
A service of Scott P. Rogers, Associate Broker, Funkhouser Real Estate Group 540.578.0102 | scott@HarrisonburgHousingToday.com
December 2016 Harrisonburg & Rockingham County Real Estate Market Report
December 12, 2016
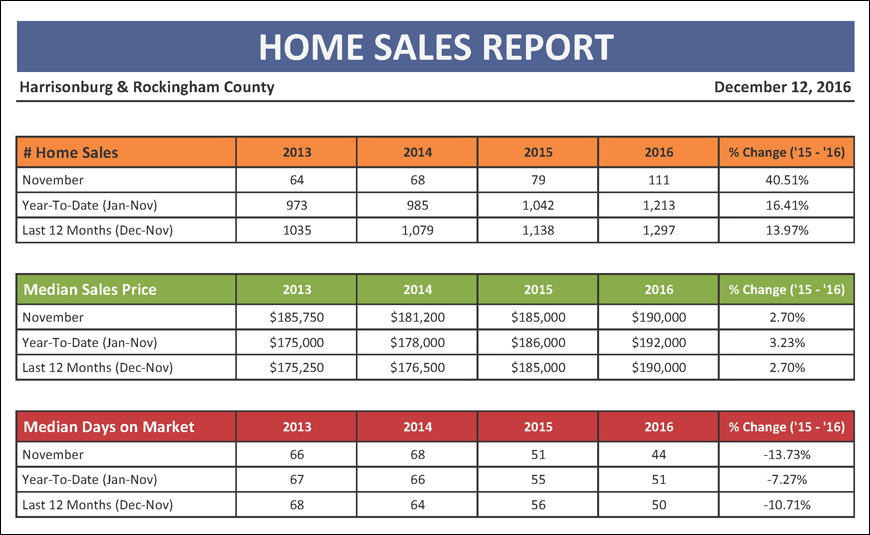
After a slightly slower October, home sales surged in November 2016 -- showing a 40.51% improvement over last November with 111 closings taking place last month in Harrisonburg and Rockingham County. This contributes to the 16.41% increase in year-to-date home sales. The median sales price is also showing an improvement over last year, having increased 3.23% (year-to-date) to $192,000 as compared to last year when it was $186,000 at this time. Finally, homes are selling more quickly this year than last, with a 7.27% decline in the median days on market, now at 51 days as compared to last year’s 55 days.
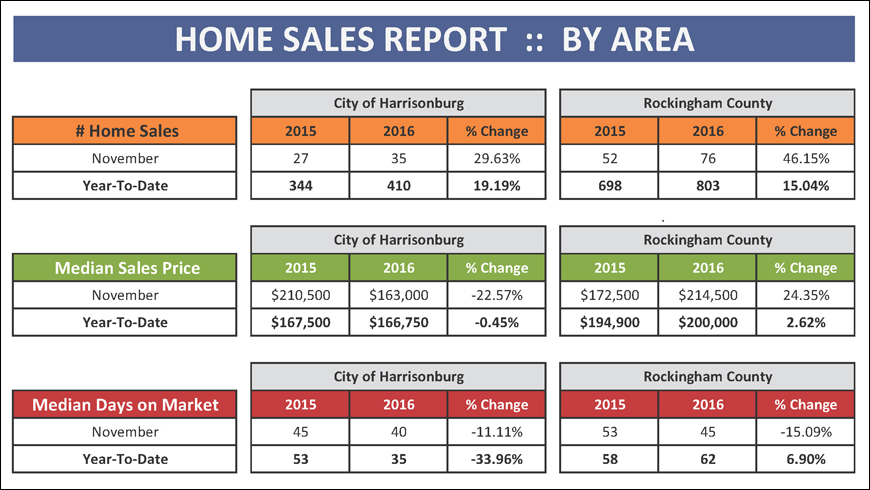
Home sales have increased slightly more in the City (+19%) than in the County (+15%) when looking at the first eleven months of the year -- though median prices have risen more in the County (+2.62%) than in the City (-0.45%) during that same timeframe. Homes are selling much faster in the City (median of 35 days) as compared to the County (median of 62 days). While the majority of home buyers purchase in the County (803 vs. 410 so far this year), as stated, we are seeing the number of buyers in the City increase more quickly than that pace is changing in the County.
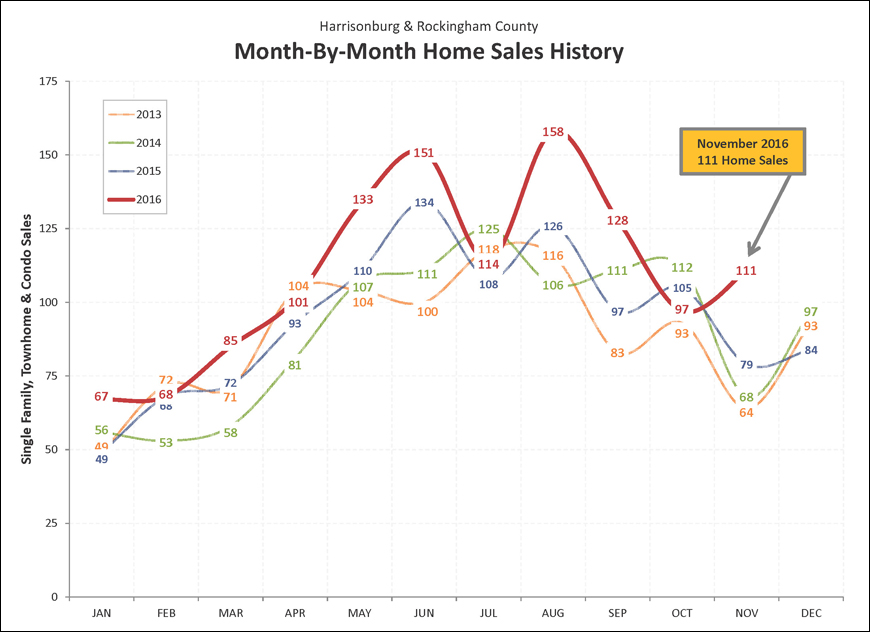
The graph above shows the month-by-month breakdown of home sales in Harrisonburg and Rockingham County with a red line for 2016 and a blue line for 2015. After a slow and somewhat disappointing month of October home sales (97) home sales shot up to 111 in November, which far exceeds the number of sales seen in each of the past three months of November. When we combine October and November sales, there were 208 sales in 2016, which still exceeds the October-November sales in each of the past three years, when we saw 184 sales in 2015, 180 sales in 2014, and 157 sales in 2013.
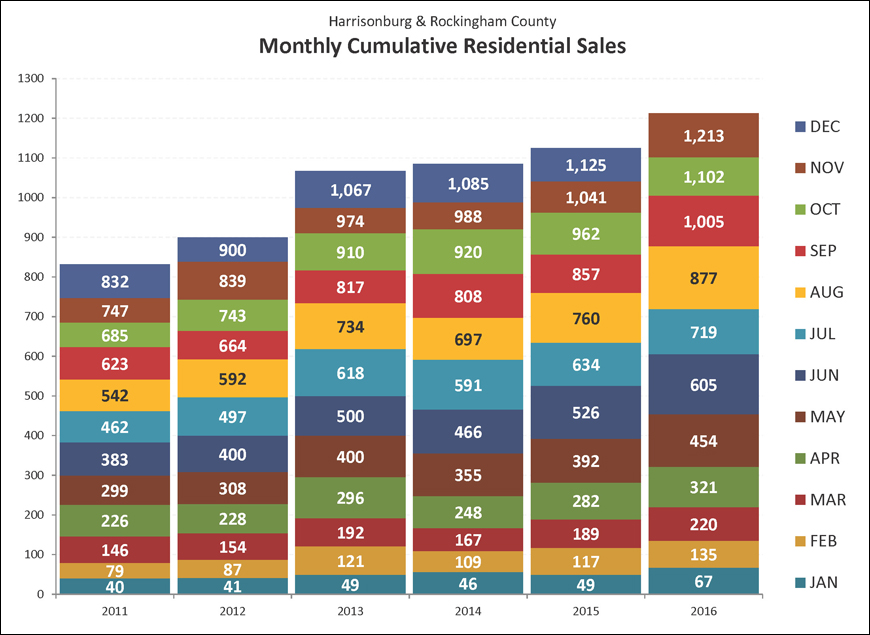
This colorful graph offers another way to look at the overall sales trends for the past few years in the Harrisonburg and Rockingham County housing market. As is evident, there were more home sales in 2015 than in any other year in the prior four years. The largest year-over-year recovery seems to have occured between 2012 and 2013 -- but we also saw a larger increase in home sales last year (2014 to 2015) than we saw the previous year (2013 to 2014). We have now (in 2016) easily soared past last year’s total of 1,125 home sales -- and we seem likely to see a total of at least 1,300 home sales in 2016.
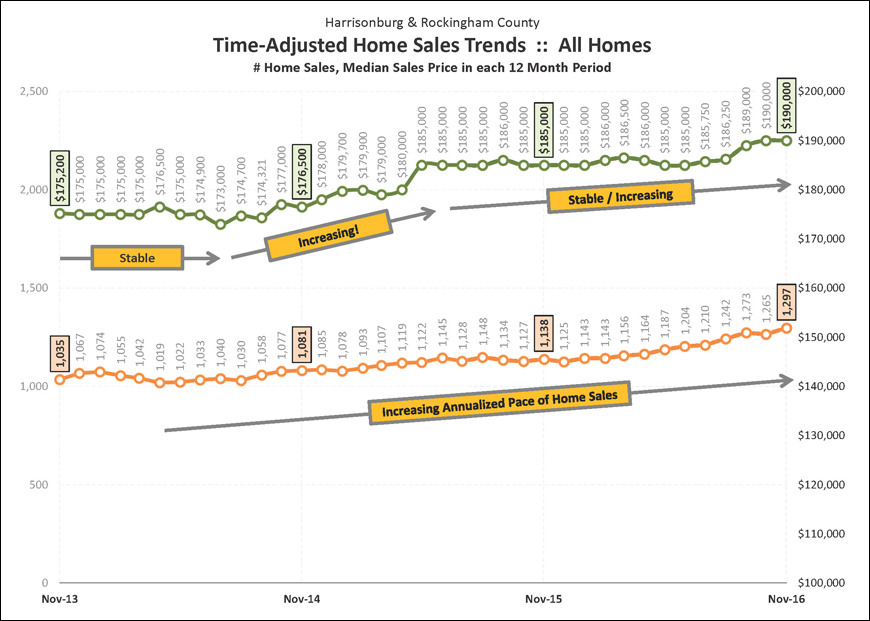
This graph shows a rolling 12 months of the number of home sales in the Harrisonburg and Rockingham County area, as well as the median price of the homes that sold during these time frames. Each data point shows one year’s worth of home sales, which eliminates the volatility of evaluating sales figures on a monthly basis. Over the past 24 months we have seen relatively consistent increases in the annual pace of home sales, which has now risen to almost 1,300 sales/year. And after many years of median sales prices hovering between $173K and $175K, they finally made their way up to $185,000 by summer 2015 and have now risen to $190,000.
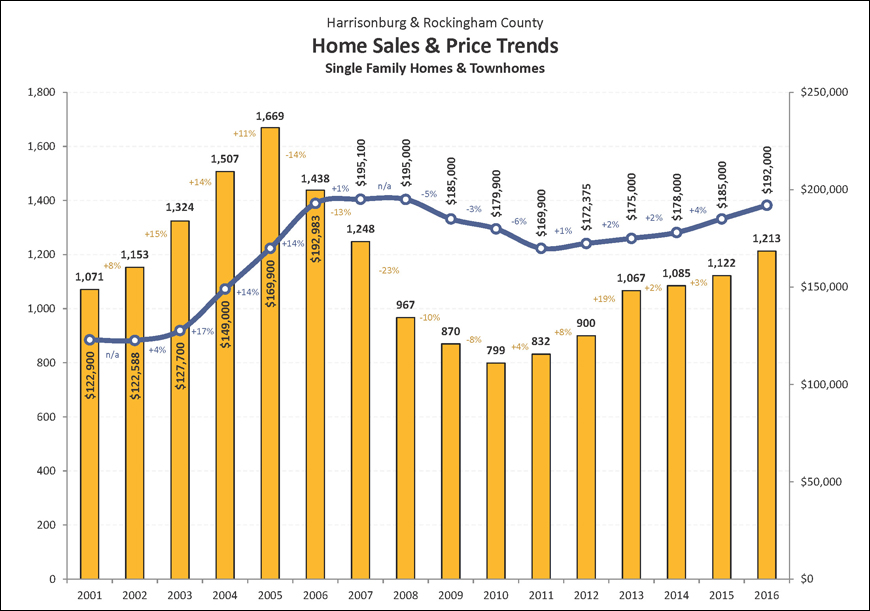
This graph provides an overall indicator of the state of our housing market, showing both the number of homes being sold each year since 2000 (yellow bars) as well as changes in the median sales price during the same time period (blue line). This past year (2015) marks the fifth (!) year in a row when we have seen an increase (+3%) in the pace of sales in our local market, which was also accompanied by a 4% increase in the median sales price. We have now seen increases in the median sales price for four years in a row, though they were small (+1%, +2%, +2%) increases up until 2015 when we saw a 4% increase in the median sales price.
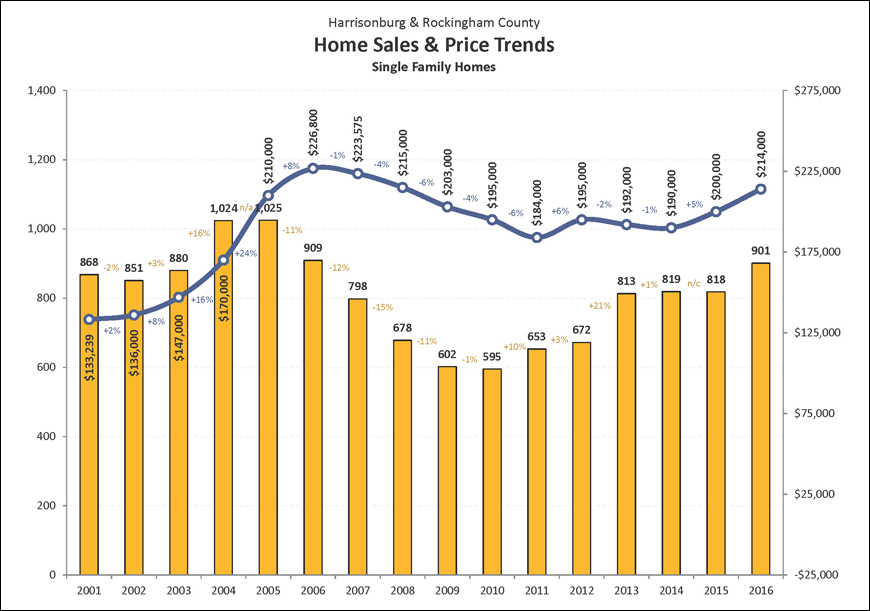
The single family home market in Harrisonburg and Rockingham County told two two different stories last year (2015), depending on whether we were evaluating the price or pace of home sales. This past year (2015) marked the third year in a row with between 810 and 820 home sales -- so, virtually no change in the pace of home sales, though the median sales price of single family homes increased by 5% to $200,000. In 2016, we have seen a solid increase in the pace of single family homes -- back up to 900+ sales, for the first time since 2006 -- and median sales prices have also increased significantly from last year.
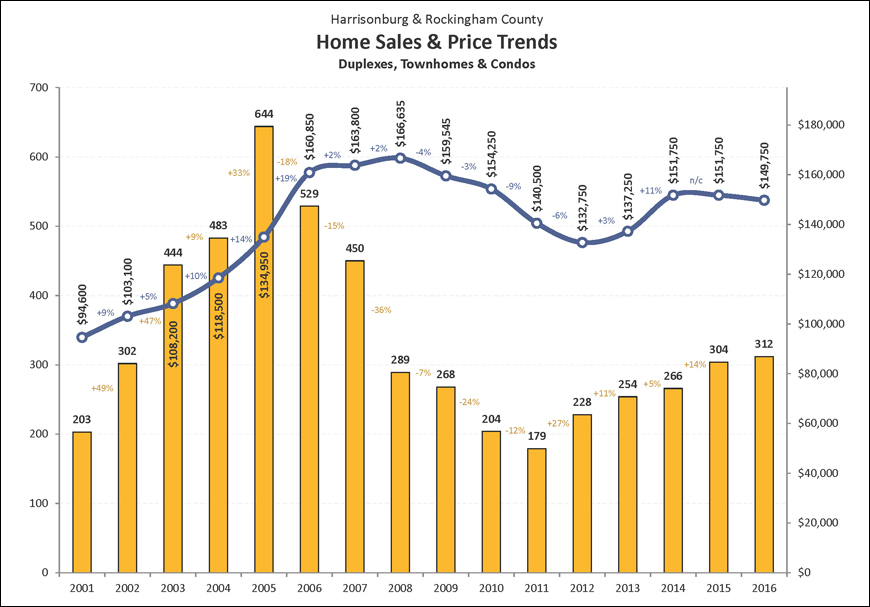
After six years (2005-2011) of rapid declines in the pace of townhouse sales in Harrisonburg and Rockingham County, the pace of sales has been rebounding since 2012. The 304 sales seen in 2015 marked the highest level of sales seen anytime between 2008 and 2015. Despite the continuing increase in the sale of townhouses (and duplexes and condominiums) we did not see any further market recovery in 2015 when it comes to price. The median sales price of these properties was again $151,750 -- the exact same median sales price we saw in 2014. Thus far in 2016 we are seeing continued stability around a $150K +/- median sales price.
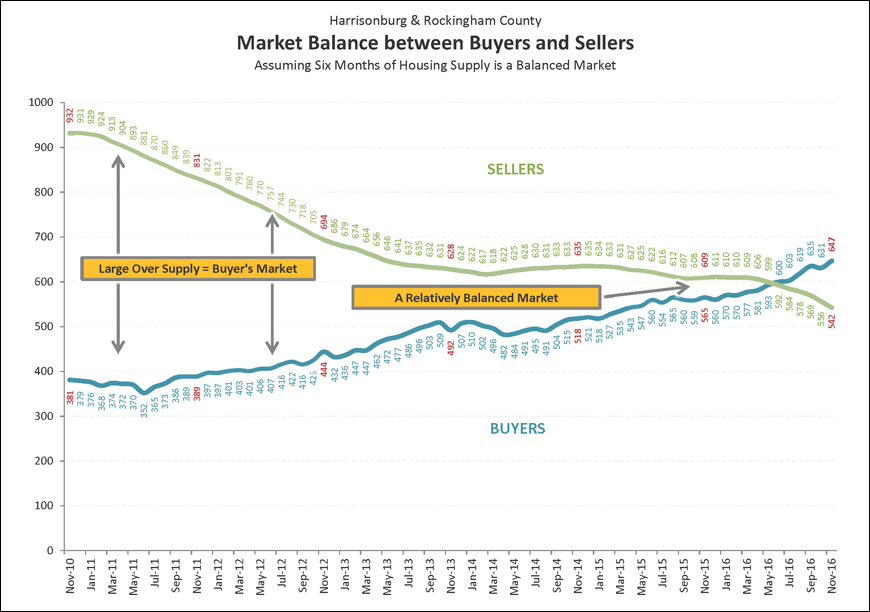
It happened! It really happened! Most housing market analysts consider six months of inventory (active listings) to be an indicator of a balanced market (between buyers and sellers). The “BUYERS” trend line above is illustrating how many buyers are buying in a six month period. The “SELLERS” trend line above is illustrating how many sellers are in the market (active listings) at any given time. Over the past four years we have seen a steady increase in buyers and a declining number of sellers. And finally, in June 2016, these two trajectories crossed! There are more buyers buying in a six month period than there are homes for sale!
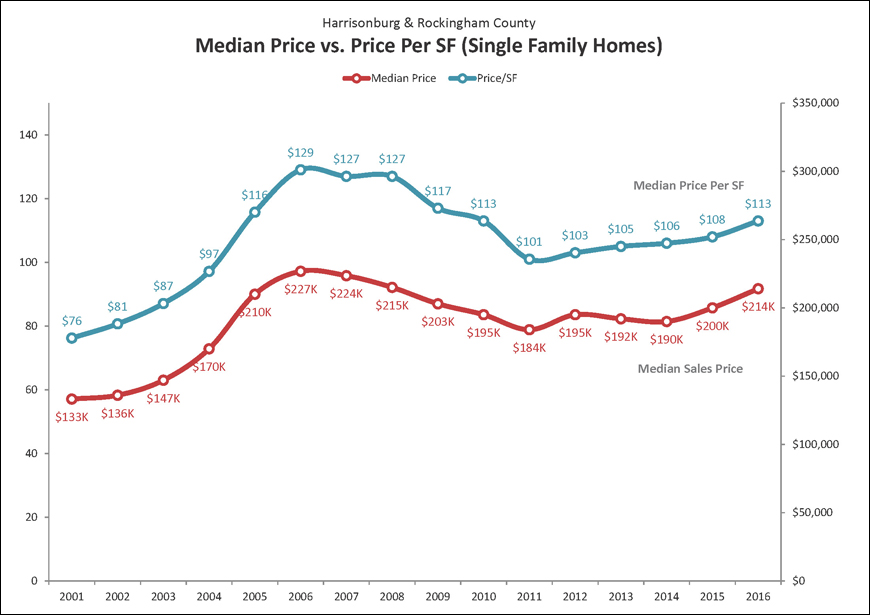
In addition to monitoring home values by overall median sales prices in our market, it can be insightful to examine the median price per square foot of homes that are selling. The graph above shows the median price per square foot of all single family homes sold over the past 10+ years. The value trend captured by this graph is quite similar to the trend shown in the single family home median sales price during the same time, which validates that assumed set of changes in home values. Over the past year (2014 to 2015) we have seen increases in both the median sales price as well as the median price per square foot of single family homes.
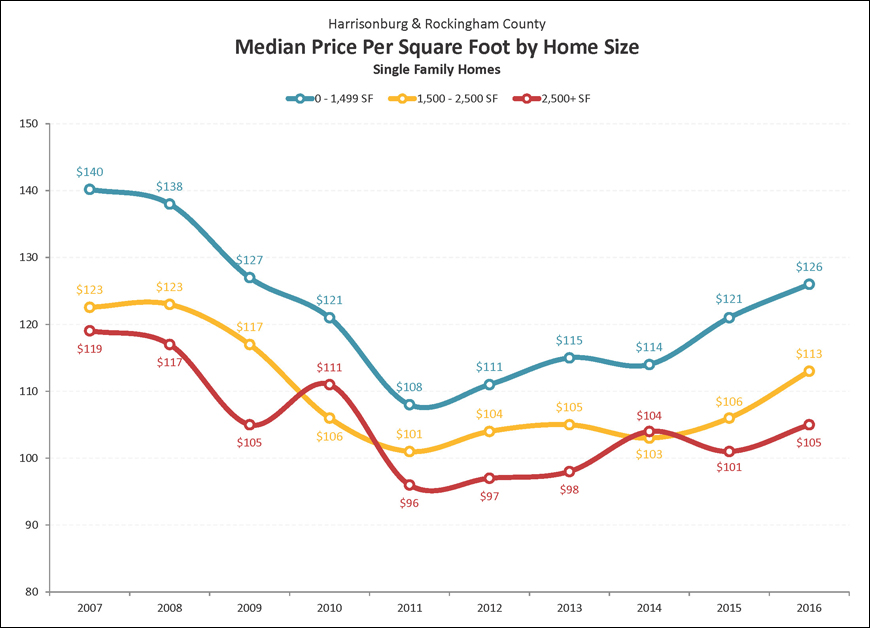
Price per square foot of single family homes certainly varies for many reasons, including the age, location, lot size and structural characteristics of each home sold. However, there are some similarities in homes of a similar size. In looking at 2016 figures, this graph illustrates that the median price per square foot of larger homes (2500+ SF) is a good bit lower ($105/SF) than that of homes with less than 1500 SF ($126/SF). These values cannot be used as an absolute standard against which the value of any home can be measured, but they can provide some helpful guidance when trying to determine the value of a home.
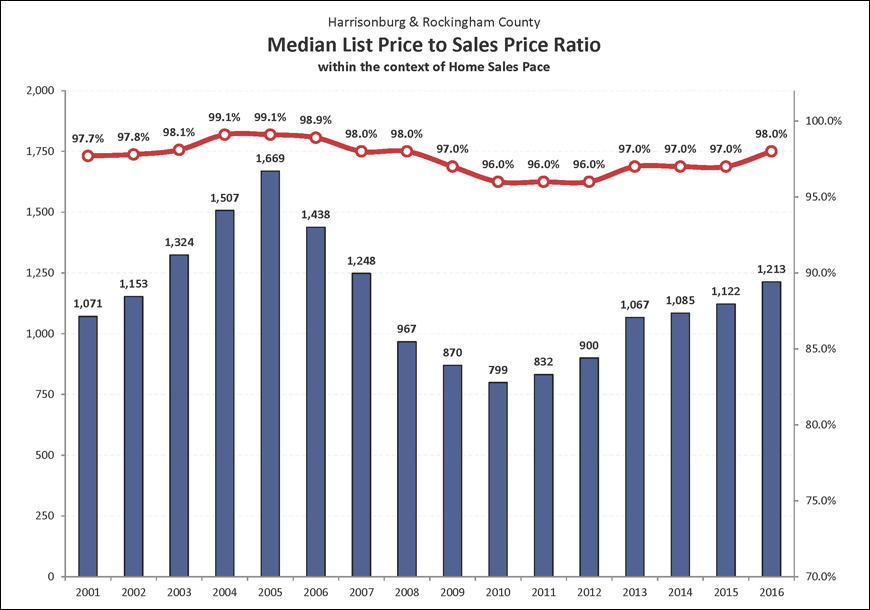
This graph shows the average list price to sales price ratio (red line) over the past 15 years as compared to the overall pace of home sales. At the peak of the housing boom (2004-2006) sellers were able to obtain a median of 99% of their asking price --- up from a median of 97.7% in 2001 before the pace of home sales started escalating. Of note, last year we almost returned to that pre-boom level -- given the 97% average during 2015 compared to the 97% - 98% average in 2000 - 2002. And now, after several years hovering at 97%, this metric has shifted back up to 98% based on data from the first eleven months of 2016.
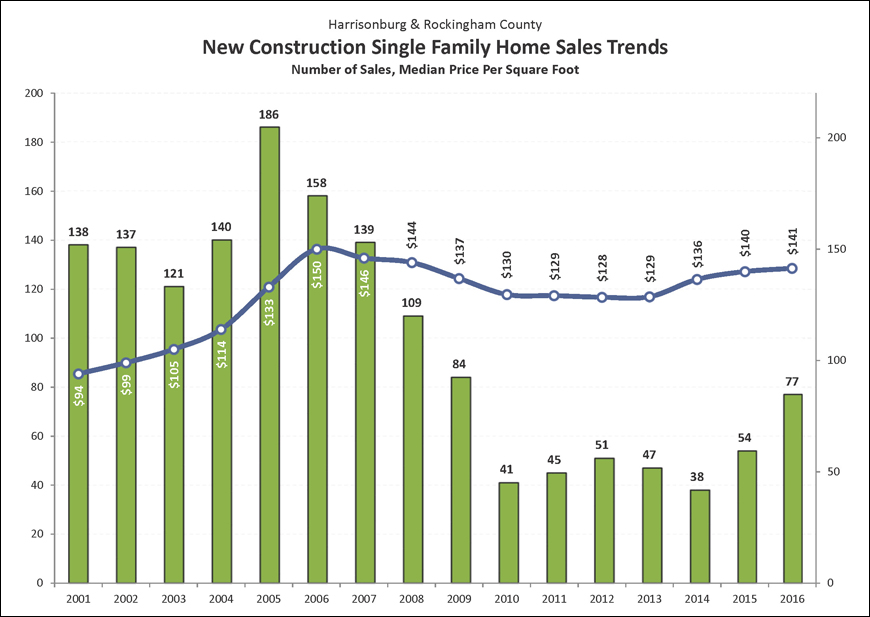
New home builders experienced a steady decline in new home sales between 2006 and 2010 -- dropping 78% from a peak of 186 to 41 sales in a year. Even if we use a starting point of 2001 (before the housing boom) we still see a 70% drop between 2001 and 2010. The number of new home sales per year has not crept up much since that time -- staying between 38 and 54 new home sales per year. This year, however, seems to be QUITE different. We have now seen 77 new home sales in the first eleven months of the year, exceeding the full year of sale seen for each of the past six years -- a welcome sign for new home builders!
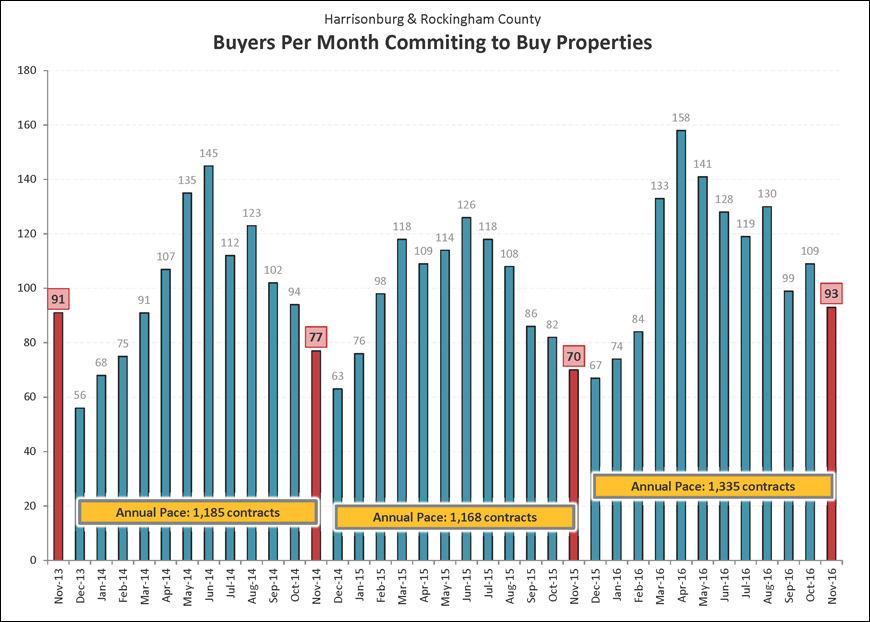
This graph clearly illustrates what a busy buying season it has been over the past nine months. We have seen an average of 123 contracts per month over the past nine months -- as compared to an average of only 103 contracts per month during the same timeframe in 2015. These strong contract numbers, clearly, are leading to the busy season of closings -- and we are likely to see yet another strong month of sales in December based on the strong month of 93 contracts seen in November 2016 as compared to only 70 contracts in November 2015.
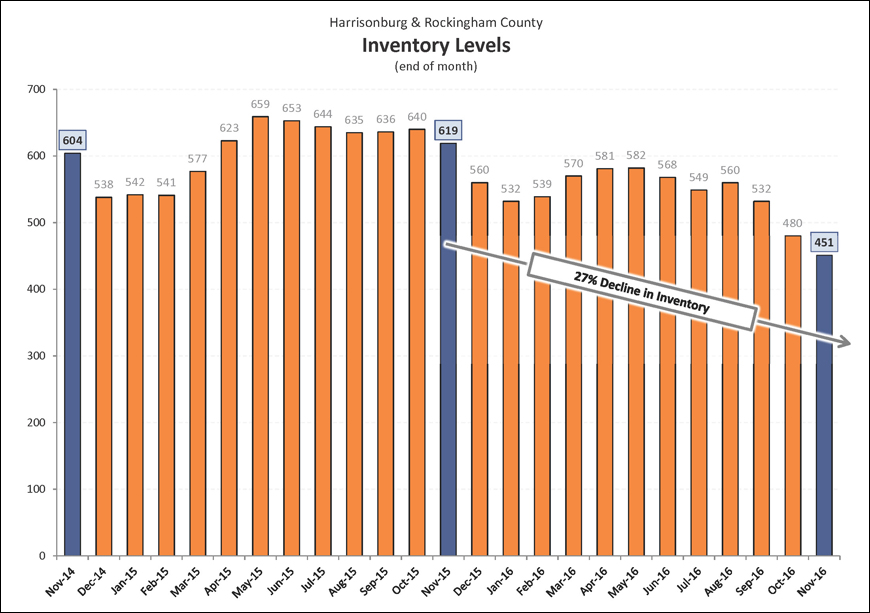
Overall sales activity is the combined effect of many would-be home buyers deciding to make an offer on a particular home -- and those decisions are not typically taken lightly. In contrast, changes in inventory levels are the combined effect of many homeowners deciding to list their home for sale -- which may be a big, significant, weighty decision, but it is not always so. Some homes that are on the market have been listed for sale by sellers who are “testing the market” and as a result, inventory levels can shift more quickly than home sales trends. Inventory levels have been declining over the past year, to a current level that is 25% down from a year ago.
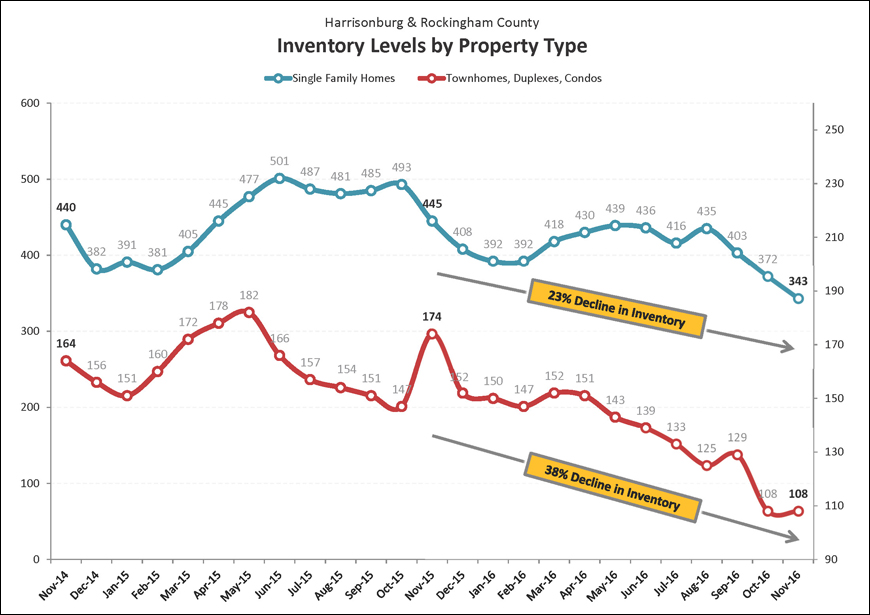
This graph examines the differences in inventory levels over time when examining only single family homes as compared to attached dwellings (townhouses, duplexes, condos). The number of single family homes for sale has decreased by 23% over the past year, while the number of townhouses, duplexes and condos for sale has decreased by 38% over the past year. As is evident, inventory levels are much lower in the Winter market, and we are likely to see further declines in inventory levels over the next few months as we continue through the winter real estate market.
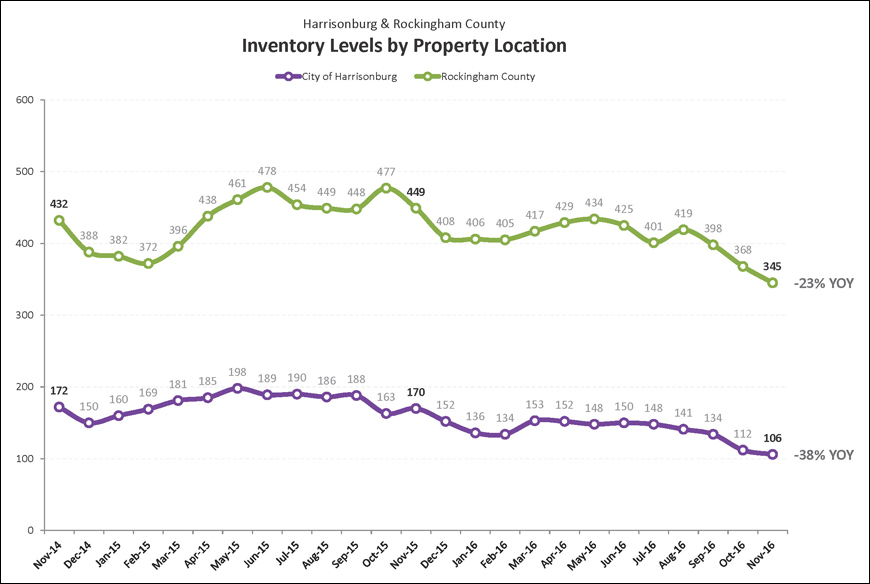
Trends in inventory level currently seem to, in many ways, transcend the City / County divide, but when looking only at inventory levels in the City, we see that there has been a relatively sizable decline (-38%) over the last year in the number of properties for sale, while in the County, there has been a slightly smaller (-23%) decline in the number of homes for sale. Despite relatively modest changes in inventory levels in the City of Harrisonburg and Rockingham County over the past year, inventory levels in the County seem much more turbulent than in the City.
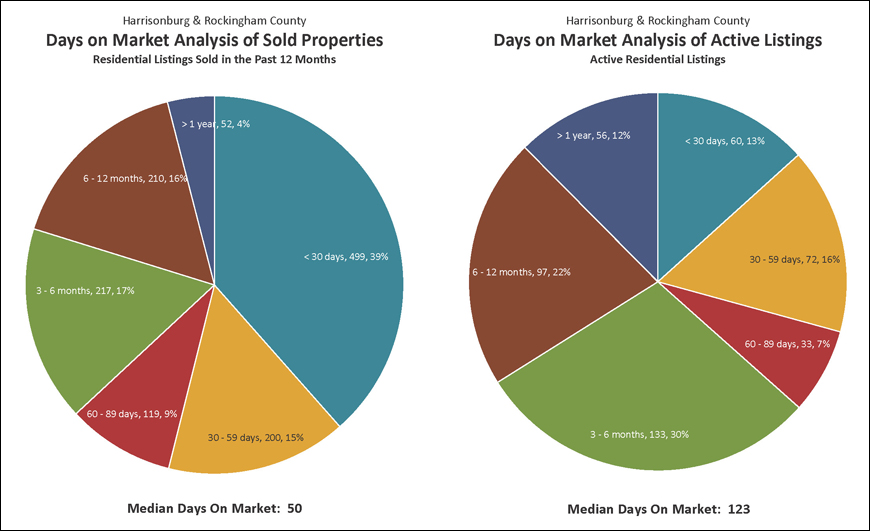
Declining inventory levels are contributing to an overall decline in the time it takes to sell a home in Harrisonburg and Rockingham County. The current median “Days on Market” is 50 for homes that have sold in the past year. Remarkably, 39% of homes that have sold in the past year have gone under contract within 30 days of having hit the market. Combine that with those that went under contract during the second month on the market, and you’ll find that 54% of homes that sell go under contract within 60 days. The graph to the right, above, shows the length of time that each active listing has been on the market for sale.
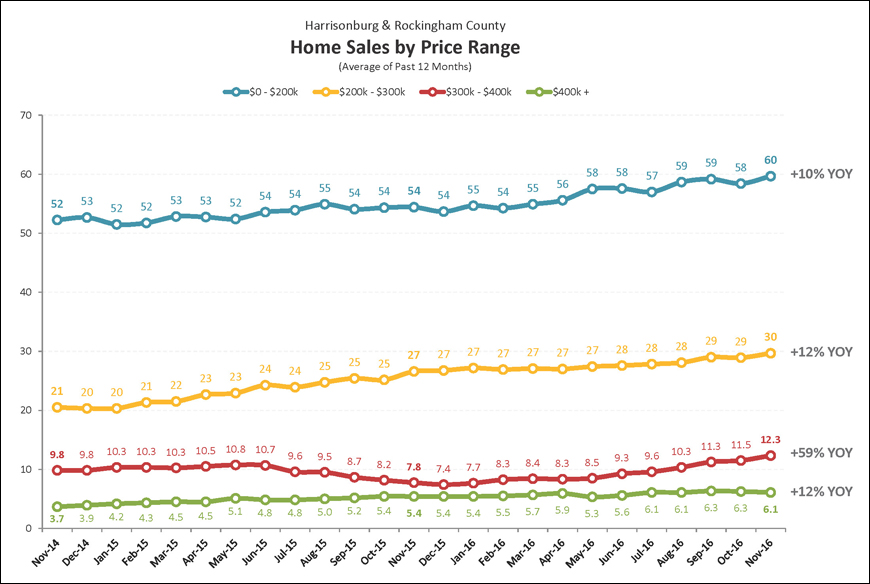
The pace of home sales in Harrisonburg and Rockingham County varies significantly based on price range. The graph above shows the average number of home sales per month (given a 12-month average) as we have passed through the past two years. Home sales have increased in all price ranges over the past year, with the most significant increase being in the $300K - $400K price range (+59% year-over-year) with the other three price ranges (under $200K, $200K - $300K, $400K+) each seeing between a 10% and 12% year-over-year increase.
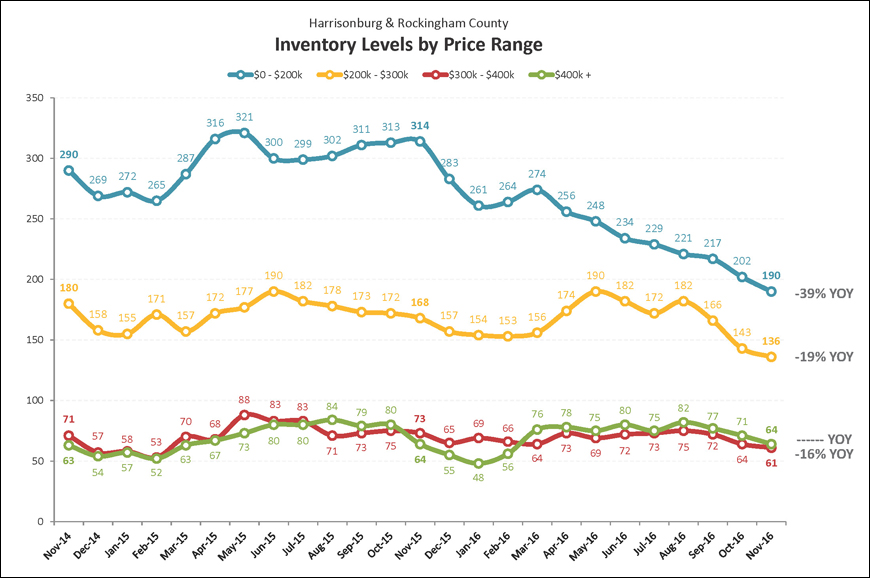
Inventory levels shift up and down seasonally, but we are also seeing differences in year-over-year trajectories in each of the four price ranges outlined above. The lowest price range (under $200K) has seen the largest decline (-39%) in inventory levels over the past year -- while all other price are seeing a year-over-year decline in inventory, but a decline that is less than 20%. The only stable price rnage has been the $400K+ price range where we have seen no year-over-year change. All four price ranges are likely to see some further decreases in inventory levels over the next few months as we continue through the winter real estate market.
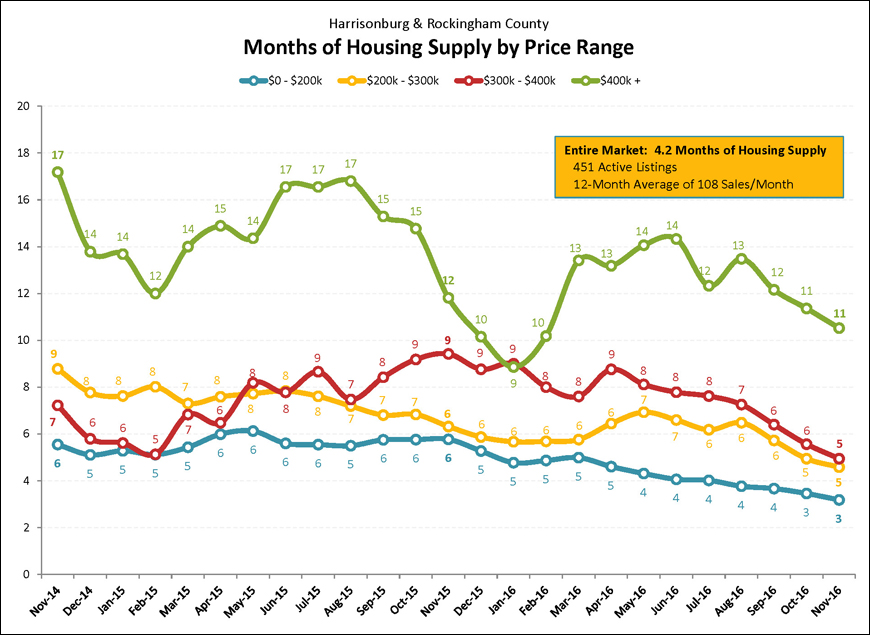
With so many home sales (lots of buyers) and so few homes on the market (not so many sellers), there are low levels of supply in some price ranges our local real estate market. The graph above illustrates that while it would take 11 months to sell all of the homes currently for sale over $400K if the same number of buyers bought each month as have been buying (on average) over the past 12 months -- it would only take three months (!!) to burn through the under $200K inventory. Many consider a six month supply to be a balance between buyers and sellers, and we are now seeing that in three of the four price ranges illustrated above.
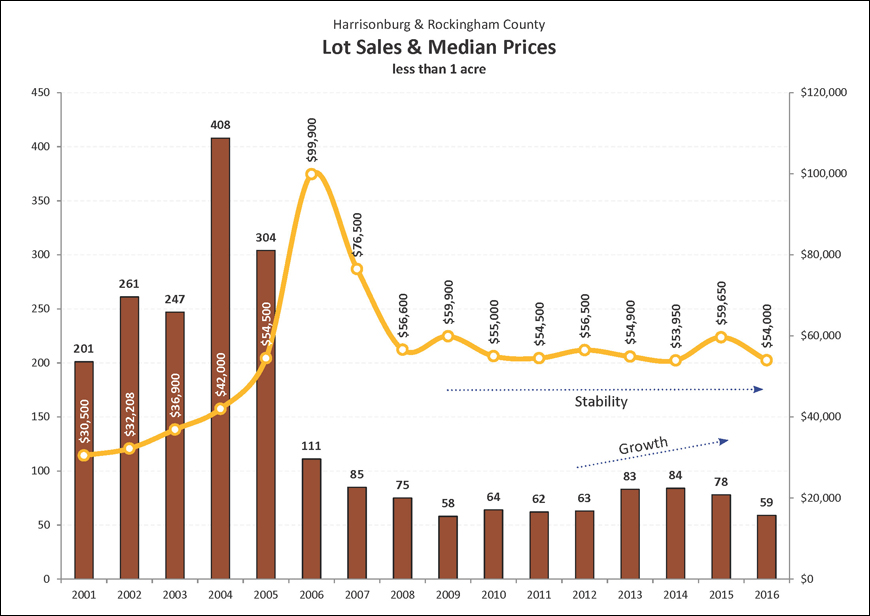
After some modest recovery in the pace of sales of lots of less than an acre over the past few years, there were fewer of these sales in 2015 (78) as compared to 2014 (84). That slower pace of lot sales did not stop sellers from being able to obtain higher prices for their building lots, as the median sales price increased from $53,950 to $59,650. This is nearly tied for the highest median sales price seen anytime since 2008. While we are unlikely to return to seeing 250 or more lot sales in a single year, hopefully we will see increases to 100+ sales per year in the coming years. Of note, the pace of these sales thus far this year is not looking promising.
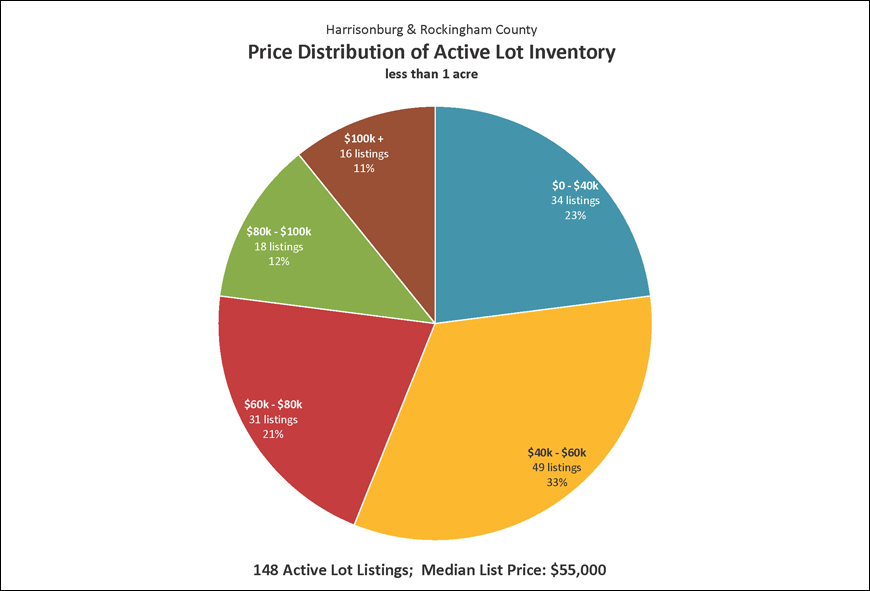
Despite the fact that only 78 lots (of less than an acre) sold in all of 2015, there are a remarkable 148 lots currently for sale. Some sanity exists in this listing market, however, as the median list price of lots for sale ($55,000) is actually a bit lower than the 2015 median sales price of $59,650. Given last year’s 78 lot sales, if no other lots were listed for sale, it would take 1.9 years to sell all of the lots currently listed for sale. As you can see above, a significant portion of the lots currently listed for sale are priced above $60,000 --- thus many sellers have offering prices higher than recent (2011-2015) median sales prices.
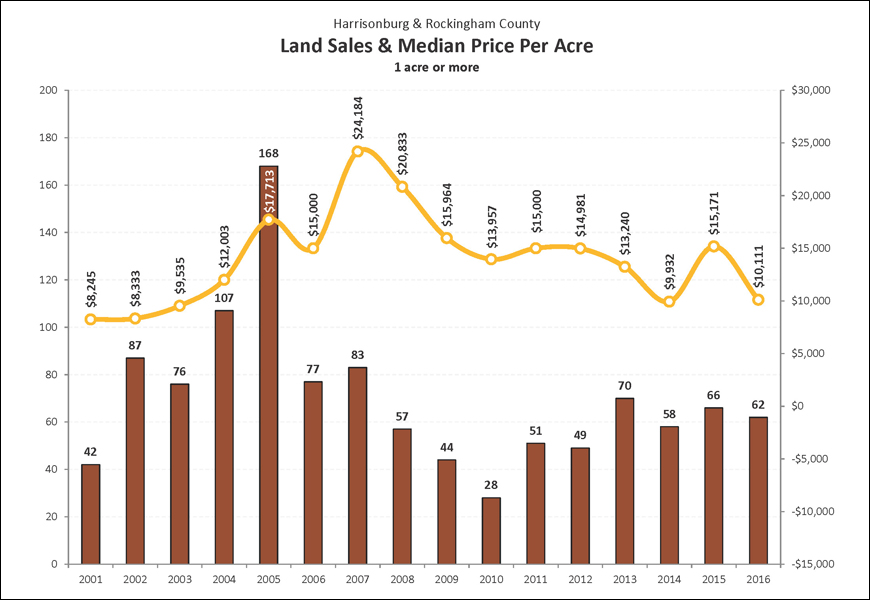
Parcels of land larger than one acre in Harrisonburg or Rockingham County peaked in 2013 at 70 sales, declined in 2014 to only 58 sales, but popped back up to 66 sales during 2015. The median price per acre of these lots with over 1 acre also jumped back up in 2015 to $15,171. This is the highest price per acre for land of over one acre seen anytime in the past six years. At this point, we seem poised to see a similar (or slightly smaller) number of these sales in 2016, and median price per acre is likely to drop back down again to the $10K - $12K range.
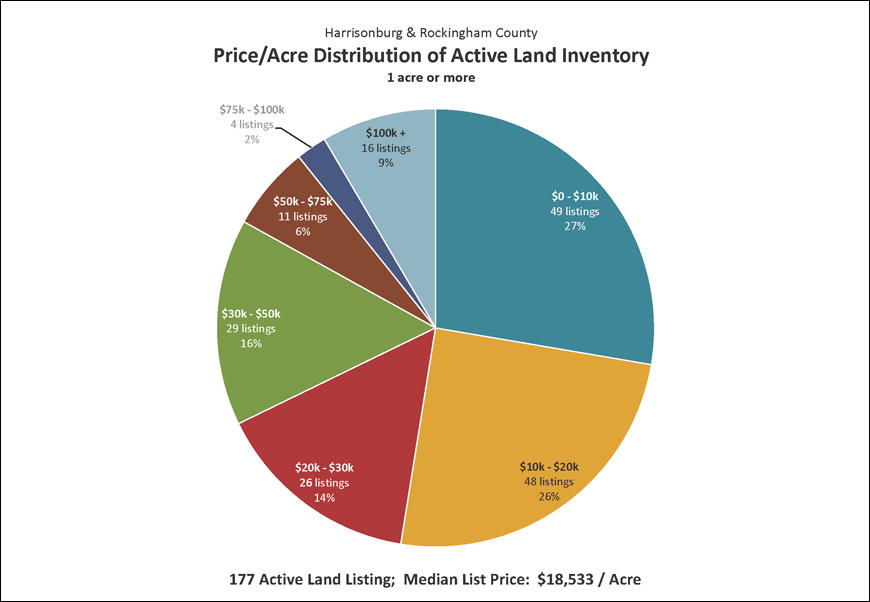
Despite the fact that only 66 parcels of land (of one acre or more) sold in all of 2015, there are a remarkable 177 parcels of land currently for sale. Furthermore, despite the fact that the median sales price of land is hovering around $15,000 per acre, the median list price of the 183 parcels for sale is currently $18,533 per acre. Given last year’s 66 land sales, if no other land is listed for sale, it would take 2.7 years to sell all of the parcels of land currently listed for sale. As you can see above, the vast majority of land listed for sale is listed at median prices per acre well above the median sales price per acre.
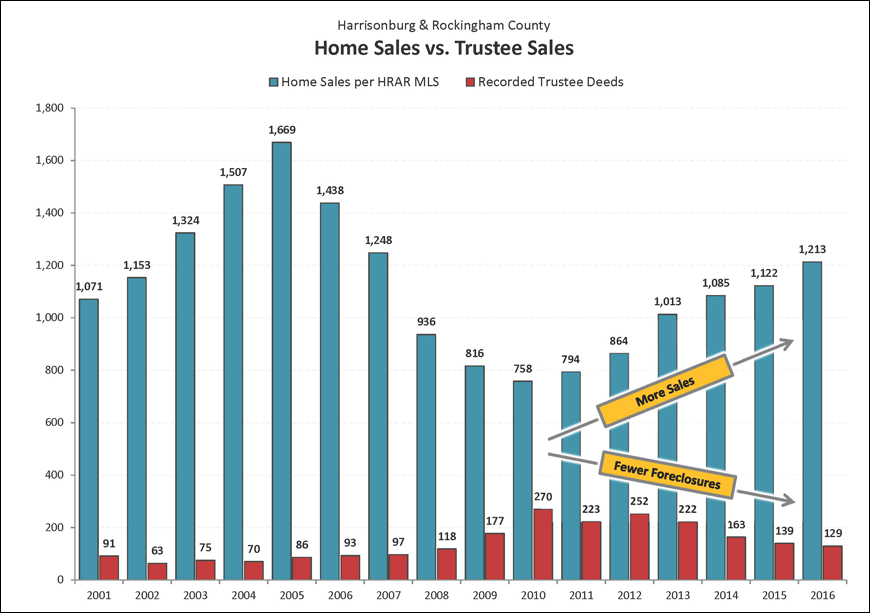
The graph above is a comparison of two imprecise measures -- but the comparison can still be helpful. The blue bars show the number of home sales recorded in the HRAR MLS -- this does not include private sales that did not involve a Realtor, nor new home sales directly from a builder. The red bars show the number of recorded Trustee Deeds. Some foreclosed properties then show up again as REO properties. The foreclosure rate in our local market area is definitely trending downward, as there were 4.6 times as many home sales as foreclosures during 2013, 6.7 times as many home sales as foreclosures in 2014, and 8.1 times as many in 2015.
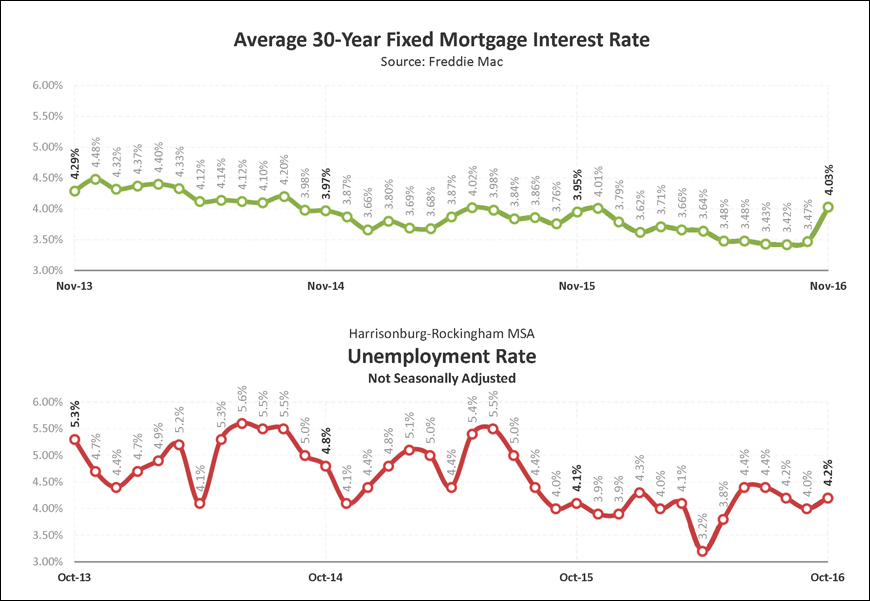
As shown in the top graph above, home buyers have seen tremendously low interest rates over the past two years -- almost always under 4%. Last month, the average mortgage interest rate jumped from 3.47% to 4.03%, and it seems unlikely that we will see rates in the 3.X% range again anytime soon. The second graph above illustrates trends in the local unemployment rate -- which has shown a general downward trend over the past several years. A low local unemployment rate and low mortgage interest rates continue to help our local housing market remain stable and start to grow in recent years.