
A service of Scott P. Rogers, Associate Broker, Funkhouser Real Estate Group 540.578.0102 | scott@HarrisonburgHousingToday.com
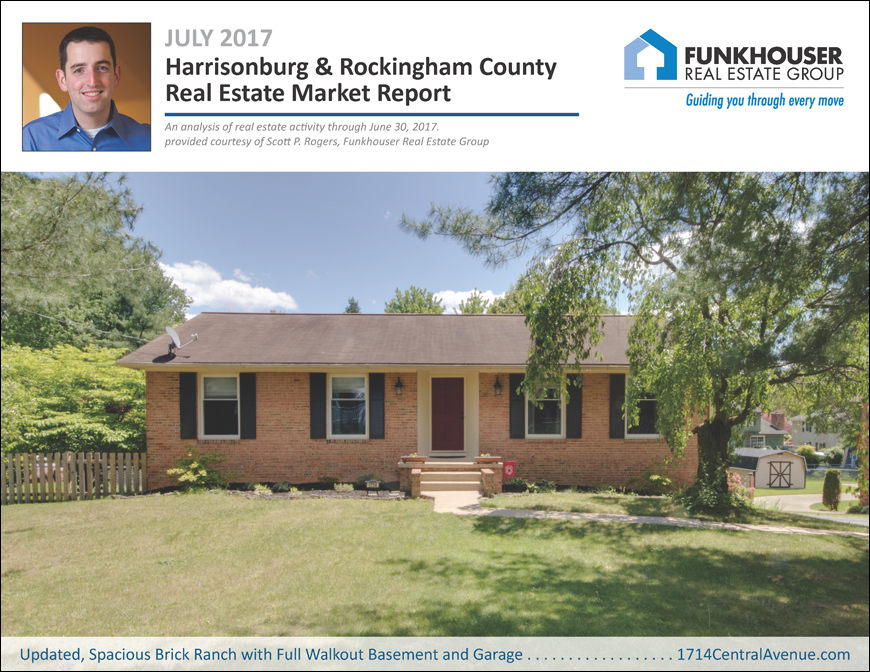
July 2017 Harrisonburg & Rockingham County Real Estate Market Report
July 11, 2017
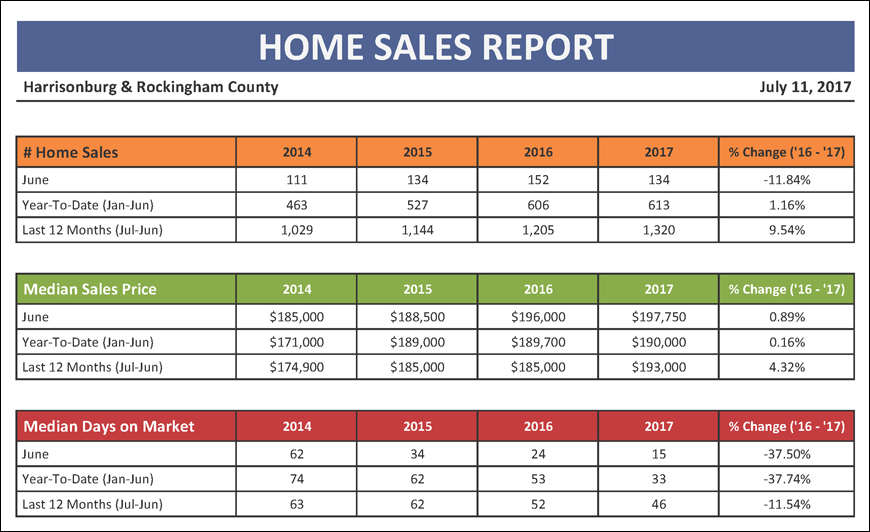
Compared to last June -- home sales cooled a bit last month -- wih only 134 closings, as compared to the 152 closings we saw in June 2016. That said, the year-to-date pace of 613 sales is still (barely) ahead of where we were last year (606 sales) at this time. The median sales price has also edged upward ever so slightly during the first six months of this year (to $190,000) as compared to where we were last year ($189,700) at this time. Perhaps the biggest change, then, is in the speed of home sales. Homes are selling 38% faster this year (median of 33 days on market) as compared to the speed of sales last year when the median was 53 days on market.
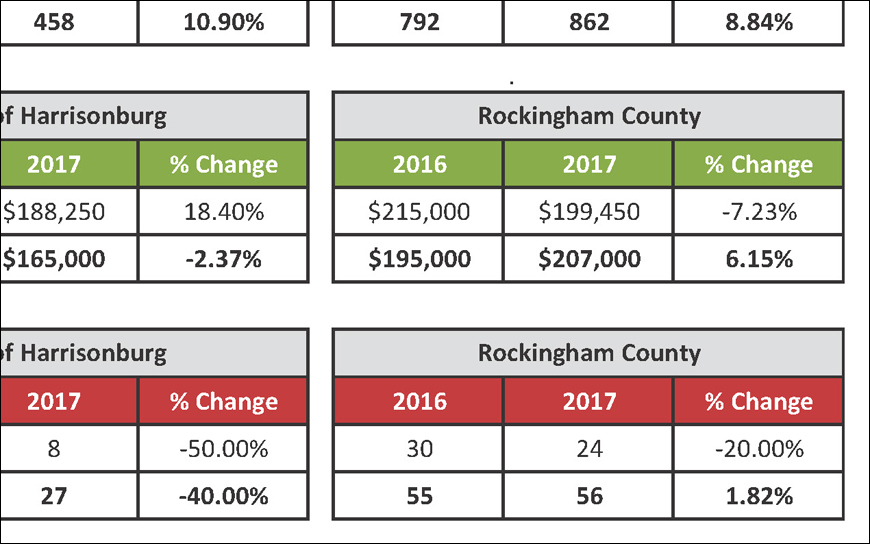
Nearly twice as many homes sell in Rockingham County each year as compared to the City of Harrisonburg -- but the pace of home sales is increasing in both areas, with a 11% year-over-year increase in City home sales and a 9% year-over-year increase in County home sales. That said, while the median sales price has increased 6% over the past year in the County, it has actually decreased by 2% in the City. Of note, City homes tend to sell much more quickly, with a median of 27 days on the market, as compared to a median of 56 days on the market in Rockingham County.
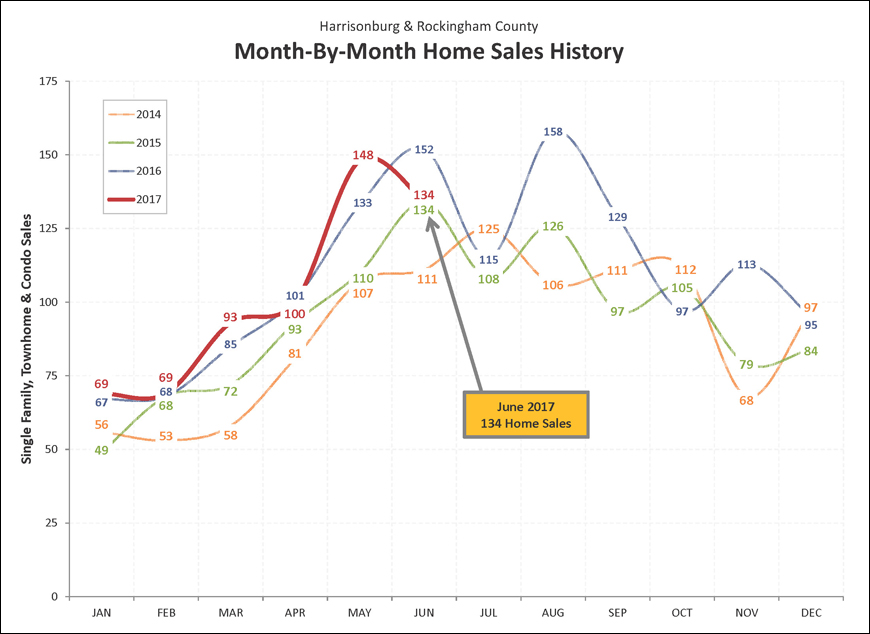
Looking back, it seems that this May and June simply reversed course from last May and June. We saw an increase of 15 home sales between May 2016 and May 2017 -- but then a decline of 18 home sales between June 2016 and June 2017. Thus, the trajectory of these Spring/Summer months was reversed this year as compared to last year. Perhaps most interestingly, this is the only year (since 2014) when we have seen a decline between May and June -- though that could be related to how high sales were in May, instead of just about how low (comparatively) sales were in June. I expet we will see a further decline in sales in July 2017.
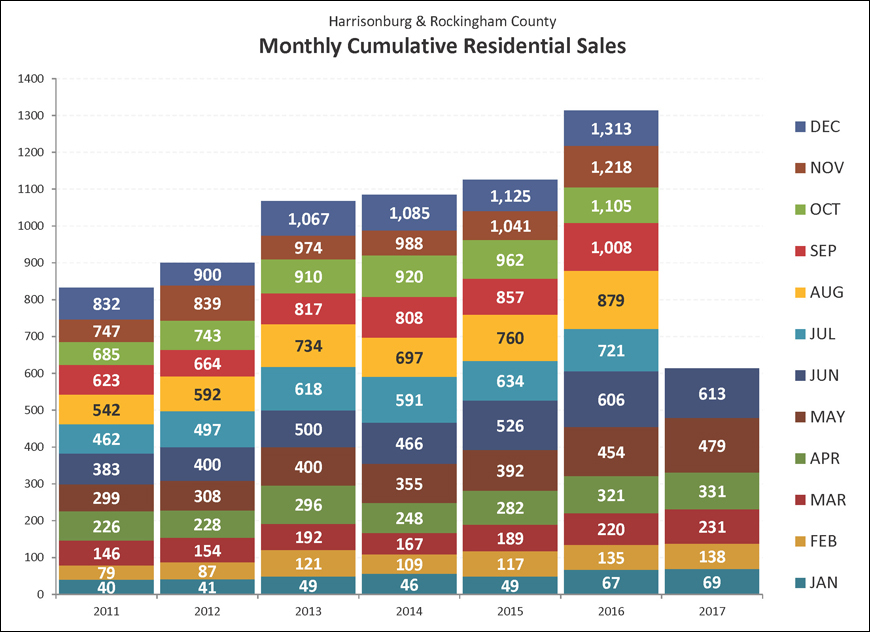
This colorful graph offers another way to look at the overall sales trends for the past few years in the Harrisonburg and Rockingham County housing market. As shown above, our local housing market experienced small incremental growth between 2013 and 2015 before seeing a sharp uptick in home sales last year in 2016. Thus far, even with just six months of data to work with, it appears we have a similar year in store for our local housing market. We will know quite a bit more as we move through July and August, to see if we are keeping on pace with the robust sales seen last year through the summer months.
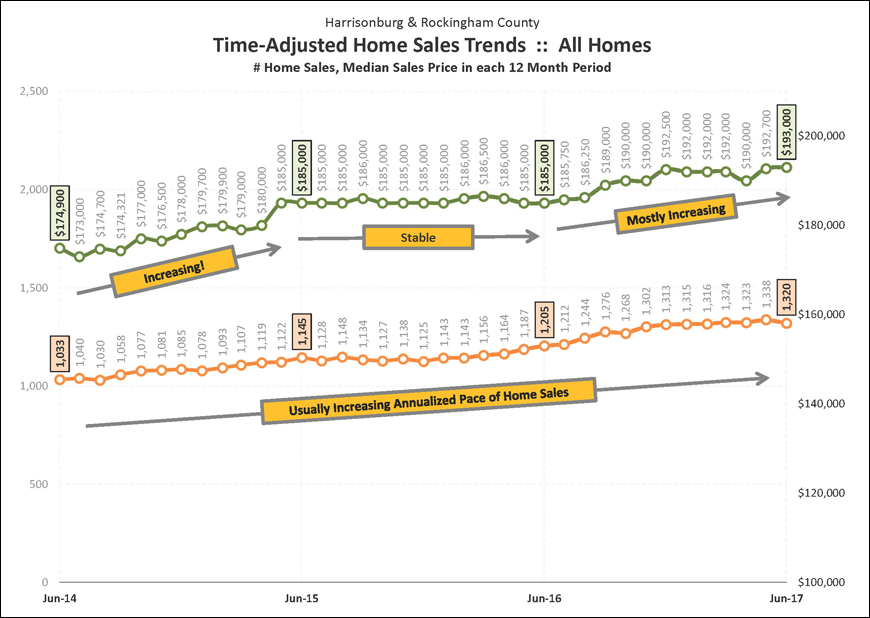
This graph shows a rolling 12 month trend line of the number of homes sold in the Harrisonburg and Rockingham County area, as well as the median price of the homes that sold during these time frames. Each data point shows one year’s worth of home sales, which eliminates the volatility of evaluating sales figures on a monthly basis. Over the past three years we have seen relatively consistent increases in the annual pace of home sales, which has now risen to more than 1,300 sales/year -- and the median sales price has finally started to increase from the $185K range over the past year to a new level of around $192,000 - $193,000.
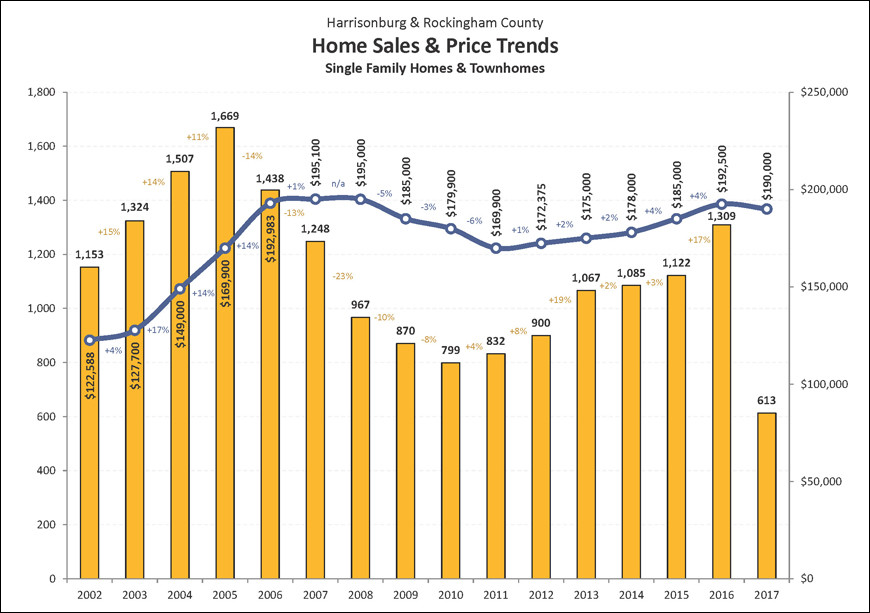
This graph provides an overall indicator of the state of our housing market, showing both the number of homes being sold each year since 2002 (yellow bars) as well as changes in the median sales price during the same time period (blue line). This past year (2016) marks the sixth (!) year in a row when we have seen an increase (+17%) in the pace of sales in our local market, which was also accompanied by a 4% increase in the median sales price. This 17% increase in the pace of sales far exceeded the increases seen in the prior two years (2%, 3%) and likely contributed to the additional 4% increase in the median sales price.
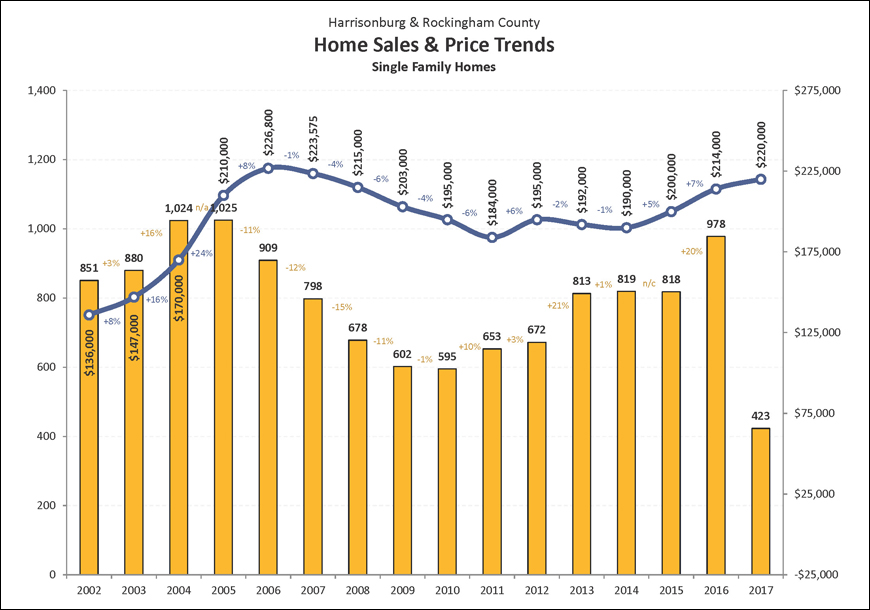
The single family home market in Harrisonburg and Rockingham County improved significantly between 2015 and 2016. After three years of relatively little change in the number of single family home sales (813, 819, 818) we saw a sudden and dramatic increase to 978 home sales. Looking back, there have only been two years (2004, 2005) when more single family homes were sold in Harrisonburg and Rockingham County. This 20% increase in the pace of single family home sales was accompanied by a 7% increase in the median sales price. Thus far, in 2017, the median sales price is staying at or above last year’s levels.
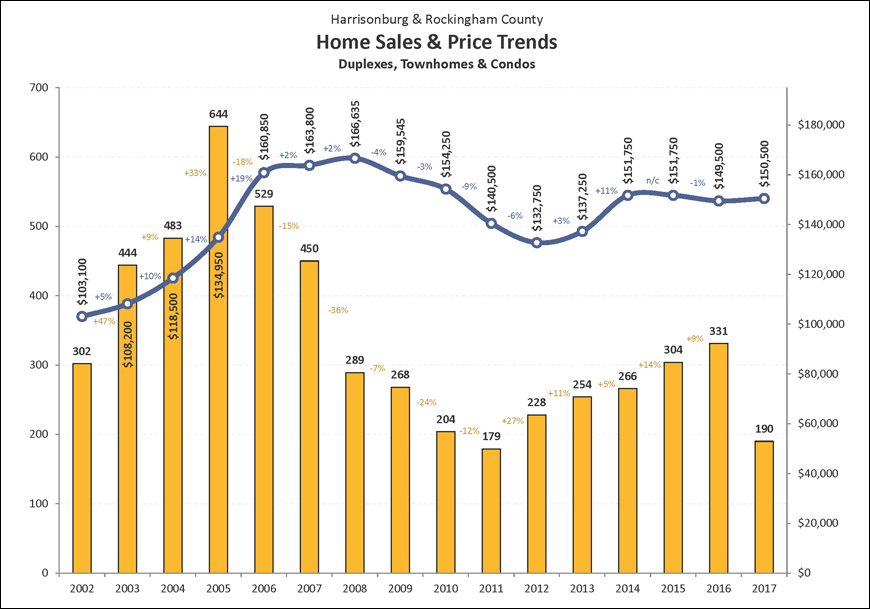
After six years (2005-2011) of rapid declines in the pace of townhouse sales in Harrisonburg and Rockingham County, the pace of sales has been rebounding since 2012. The 331 sales seen in 2016 marked the highest level of sales seen anytime between 2008 and 2016. Despite the continuing increase in the sale of townhouses (and duplexes and condominiums), we did not see any further market recovery in 2015 or 2016 when it comes to price, and in fact, the median sales price of these properties dropped slightly in 2016 to $149,500 -- down 1% from the median sales price of $151,750 in both 2014 and 2015.
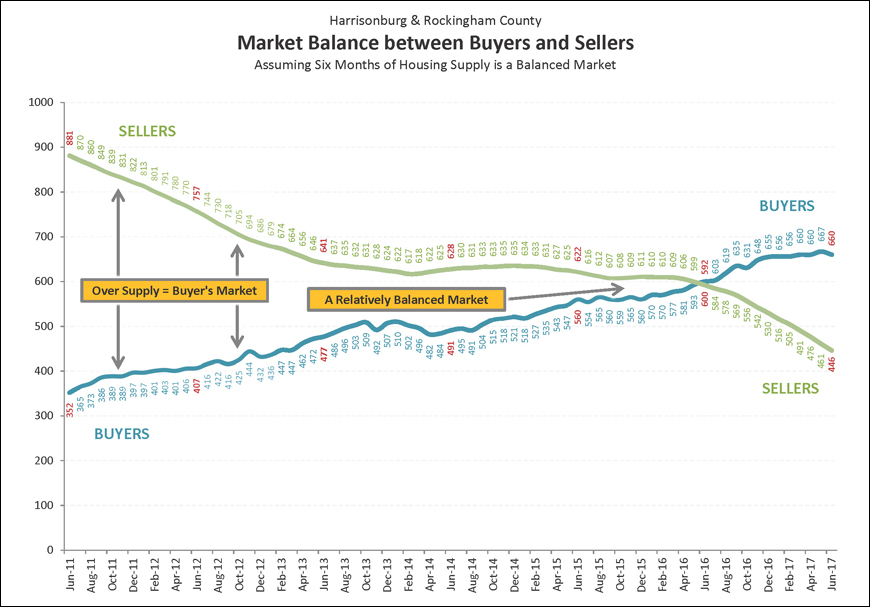
Most housing market analysts consider six months of inventory (active listings) to be an indicator of a balanced market (between buyers and sellers). The “BUYERS” trend line above is illustrating how many buyers are buying in a six month period. The “SELLERS” trend line above is illustrating how many sellers are in the market (active listings) at any given time. Over the past four years we have seen a steady increase in buyers and a declining number of sellers. In June 2016, these two trajectories crossed, and there was no turning back. There are now many more buyers buying in a six month period than there are homes for sale!
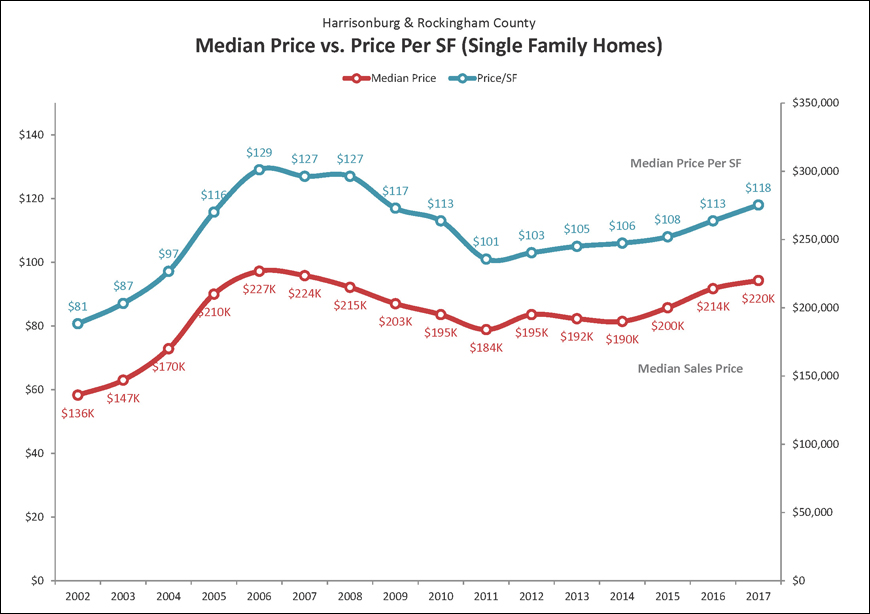
In addition to monitoring home values by overall median sales prices in our market, it can be insightful to examine the median price per square foot of homes that are selling. The graph above shows the median price per square foot of all single family homes sold over the past 10+ years. The value trend captured by this graph is quite similar to the trend shown in the single family home median sales price during the same time, which validates that assumed set of changes in home values. Over the past year (2015 to 2016) we have seen increases in both the median sales price as well as the median price per square foot of single family homes.
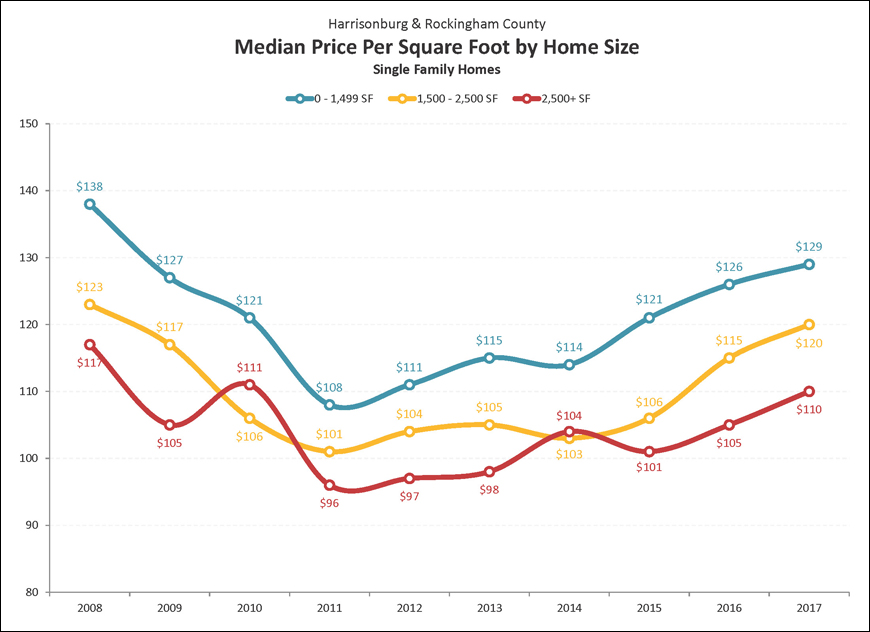
Price per square foot of single family homes certainly varies for many reasons, including the age, location, lot size and structural characteristics of each home sold. However, there are some similarities in homes of similar sizes. Looking at 2016 figures, this graph illustrates that the median price per square foot of larger homes (2500+ SF) is a good bit lower ($110/SF) than that of homes with less than 1500 SF ($129/SF). These values cannot be used as an absolute standard against which the value of any home can be measured, but they can provide some helpful guidance when trying to determine the value of a home.
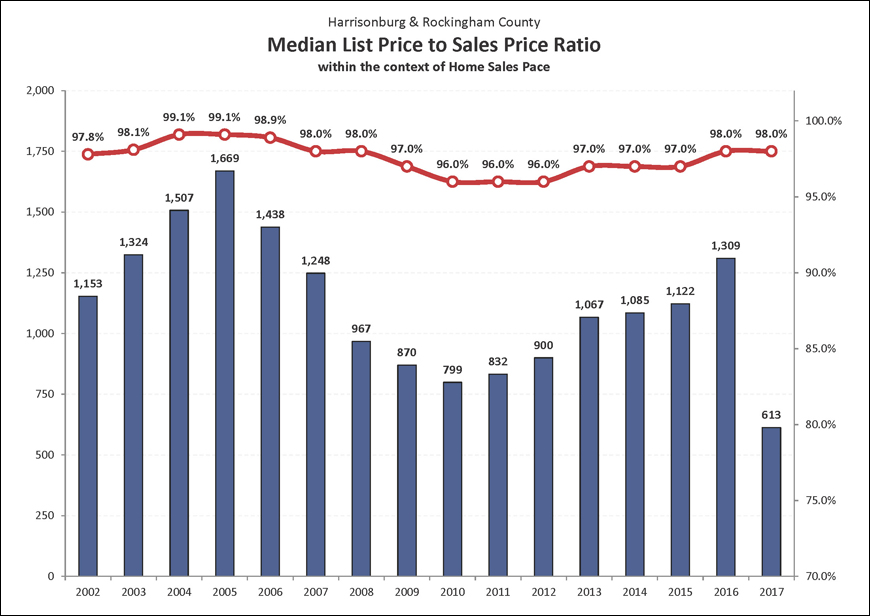
This graph shows the average list price to sales price ratio (red line) over the past 15 years as compared to the overall pace of home sales. At the peak of the housing boom (2004-2006) sellers were able to obtain a median of 99% of their asking price --- up from a median of 97.7% in 2001 before the pace of home sales started escalating. Then, when the pace of home sales slowed (through 2010) we saw a decline in this metric to 96%, where we stayed for three years (2010, 2011, 2012). Sellers started selling for slightly more in 2013-2015 when they could obtain 97% of their list price. This increased to 98% in 2016 and thus far is holding steady in 2017.
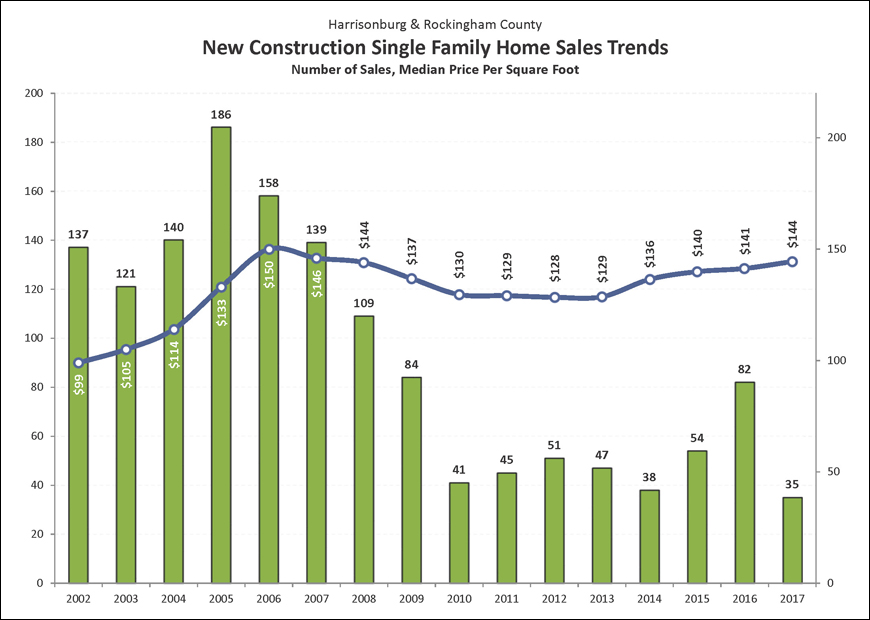
New home builders experienced a steady decline in new home sales between 2006 and 2010 -- dropping 78% from a peak of 186 to 41 sales in a year. Even if we use a starting point of 2001 (before the housing boom) we still see a 70% drop between 2001 and 2010. The number of new home sales per year has not crept up much since that time -- staying between 38 and 54 new home sales per year. This past year, however, was QUITE different. There were a total of 82 new home sales last year, exceeding the full year of sale seen for each of the past six years -- a welcome sign for new home builders! It is unclear whether 2017 will match that 2016 pace.
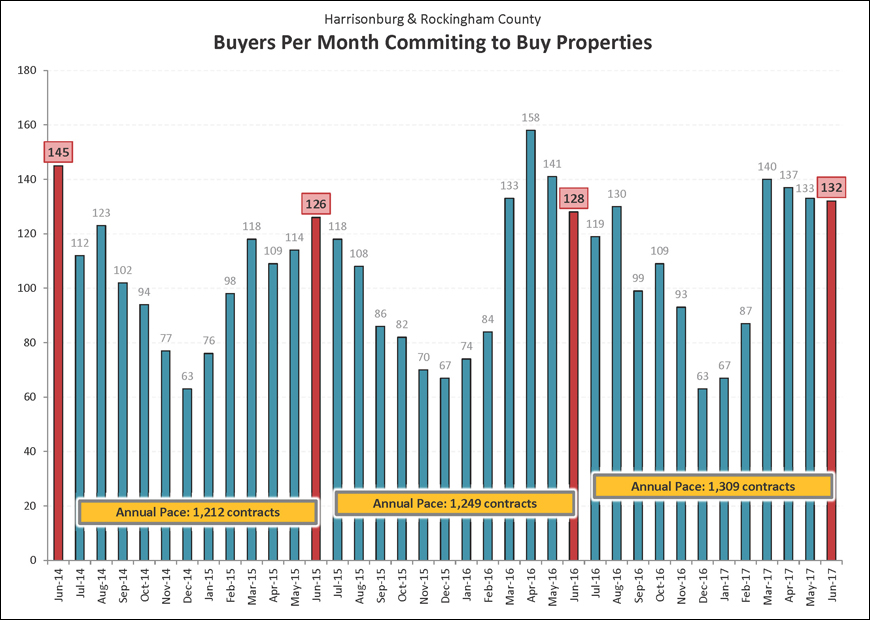
Strong contract activity is typically an indicator of strong months of sales to come. There were 132 contracts signed in June 2017 -- which is a slight increase over the 126 and 128 contracts seen during the past two months of June. The past four months, in total, have been a strong series of contracts with between 132 and 140 contracts being signed each month. Looking forward, we should expect to see at least two more months (July, August) of strong contract activity before buying activity starts to slow down, at least slightly when we head into September and October.
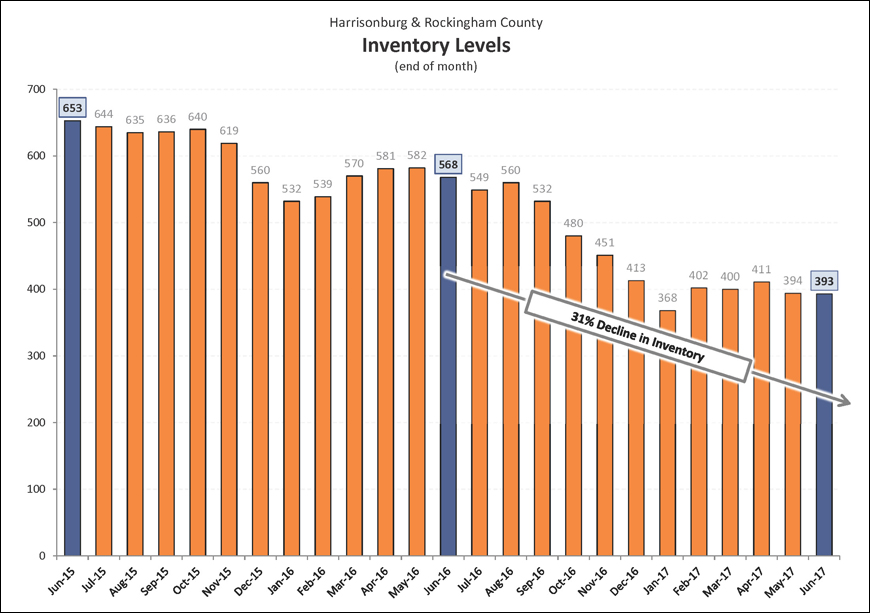
Overall sales activity is the combined effect of many would-be home buyers deciding to make an offer on a particular home -- and those decisions are not typically taken lightly. In contrast, changes in inventory levels are the effect of many homeowners deciding to list their home for sale -- which may be a significant decision, but it is not always so. Some homes that are on the market have been listed for sale by sellers who are “testing the market” and as a result, inventory levels can shift more quickly than home sales trends. Inventory levels have been declining drastically over the past year -- and are now 31% lower than they were one year ago.
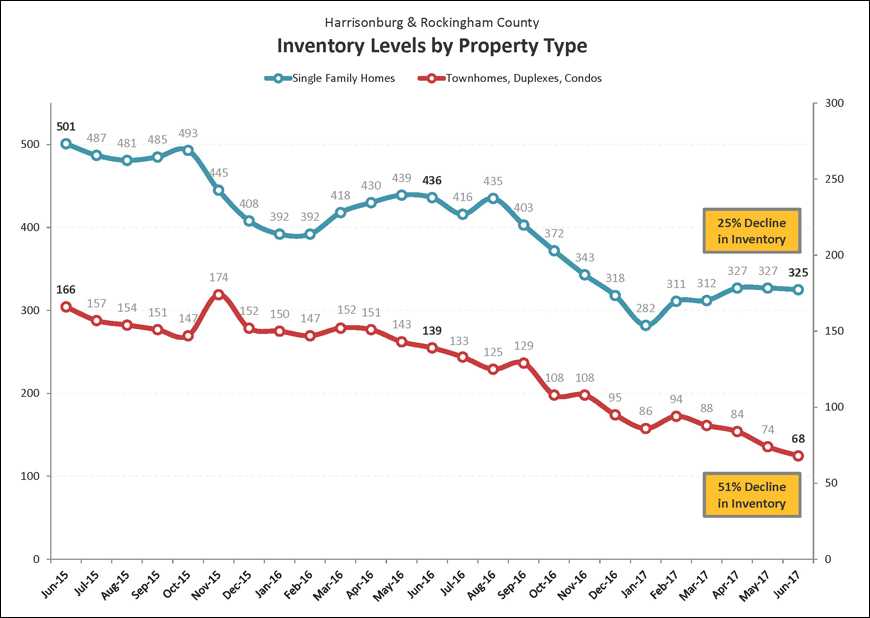
This graph examines the differences in inventory levels over time when examining only single family homes as compared to attached dwellings (townhouses, duplexes, condos). The number of single family homes for sale has decreased by 26% over the past year, while the number of townhouses, duplexes and condos for sale has decreased by an astonishing 51% over the past year! All we can hope is that these inventory levels will start to climb again as we continue through the Summer market, as there are many buyers in our local market who are anxious to buy, but not finding many properties that they would like to purchase.
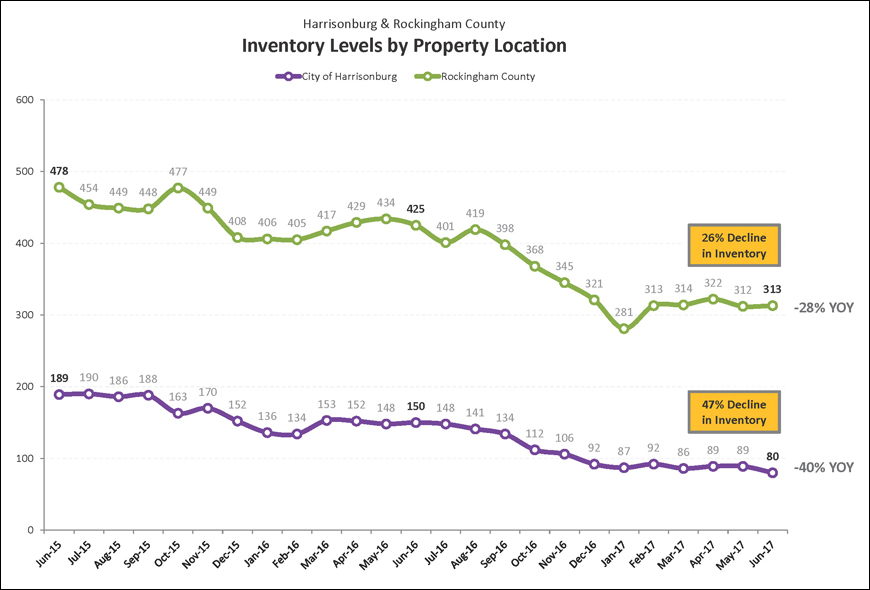
Inventory levels have shifted much more dramatically in the City of Harrisonburg over the past two years as compared to in Rockingham County. We have seen nearly a 50% decline in the number of homes for sale in the City of Harrisonburg when comparing today to one year ago -- while inventory levels have only declined by 26% in Rockingham County during that same timeframe. If finding a home to buy is difficult right now, it is even more difficult if you are looking in the City of Harrisonburg. Fewer and fewer homes are available to purchase.
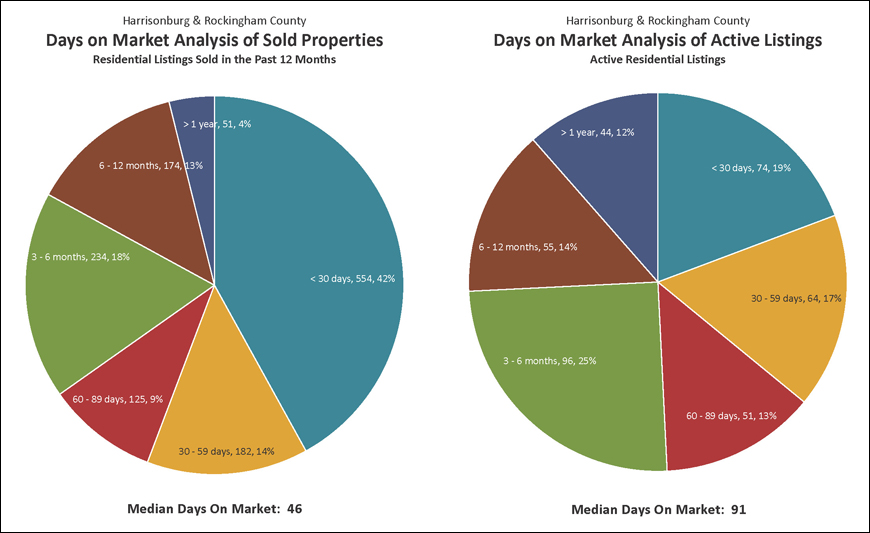
Declining inventory levels are contributing to an overall decline in the time it takes to sell a home in Harrisonburg and Rockingham County. The current median “Days on Market” is 46 days for homes that have sold in the past year. Remarkably, 42% of homes that have sold in the past year have gone under contract within 30 days of having hit the market. Combine that with those that went under contract during the second month on the market, and you’ll find that 56% of homes that sell go under contract within 60 days. The graph to the right, above, shows the length of time that each active listing has been on the market for sale.
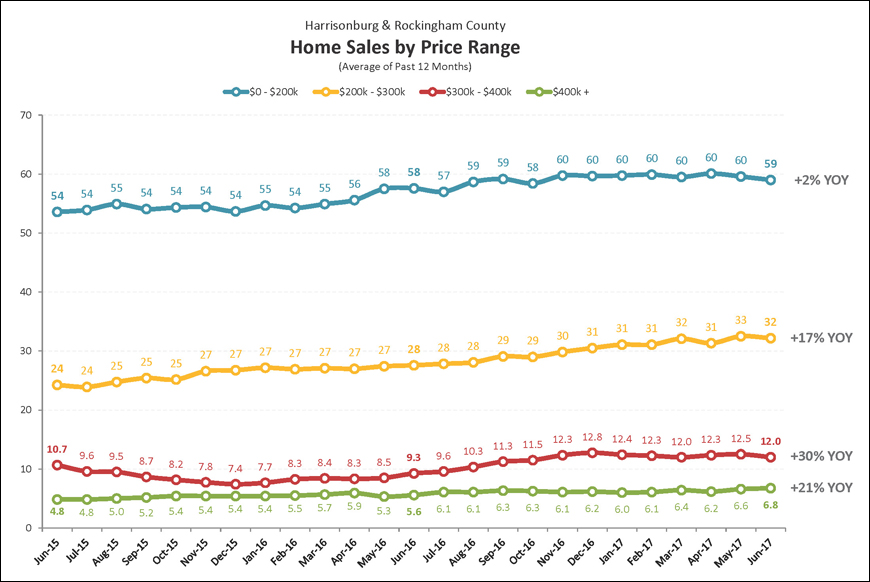
The pace of home sales in Harrisonburg and Rockingham County varies significantly based on price range. The graph above shows the average number of home sales per month (given a 12-month average) as we have passed through the past two years. Home sales have increased in all price ranges over the past year, with the most significant increase being in the $300K - $400K price range (+30% year-over-year), though the $200K - $300K and the $400K+ price ranges have also seen significant increases in sales pace, with 17% and 21% respectively.
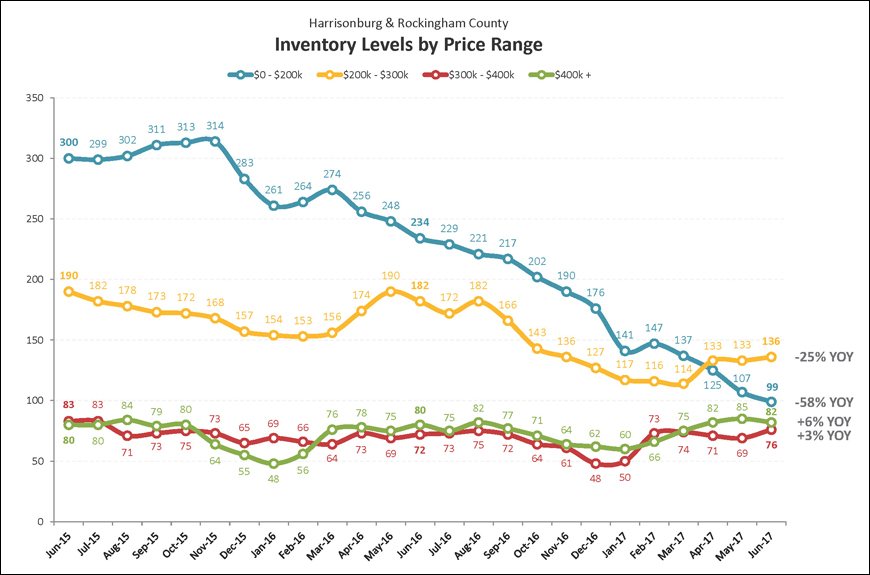
Inventory levels shift up and down seasonally, but we are also seeing differences in year-over-year trajectories in each of the four price ranges outlined above. The lowest price range (under $200K) has seen an astonishing 58% decline in inventory levels over the past year -- which is followed by a 25% decline in the $200K - $300K price range. We have seen very little change in inventory levels in the $300K - $400K price range (+3%) and the $400K+ inventory level (+6%). It is not clear how low these under $200K inventory levels could go at this point. Two years ago, buyers in this price range had 300 options, and today -- 99!
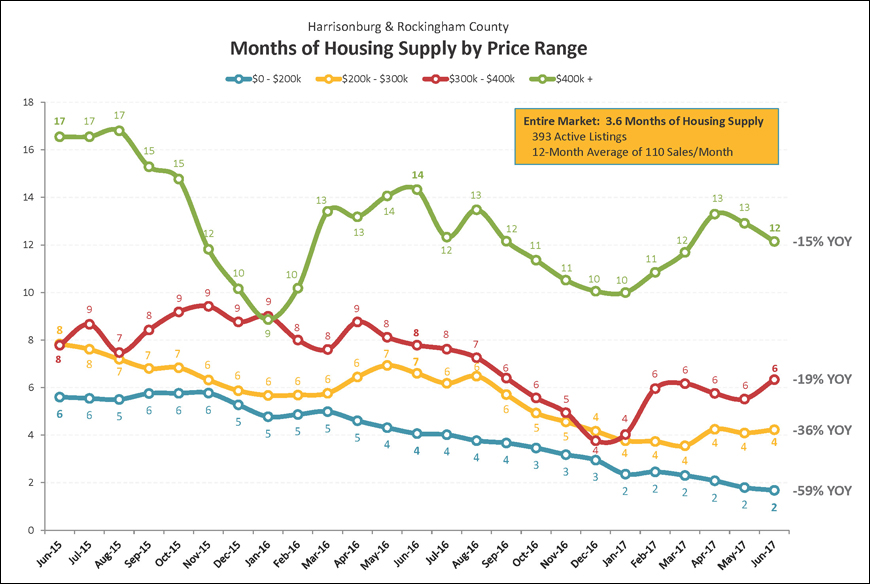
With so many home sales (lots of buyers) and so few homes on the market (not so many sellers), there are low levels of supply in some price ranges in our local real estate market. The graph above illustrates that while it would take 12 months to sell all of the homes currently for sale over $400K if the same number of buyers bought each month as have been buying (on average) over the past 12 months -- it would only take two months (!!) to burn through the under $200K inventory. Many consider a six month supply to be a balance between buyers and sellers, and we are now seeing less than that in two of the four price ranges illustrated above.
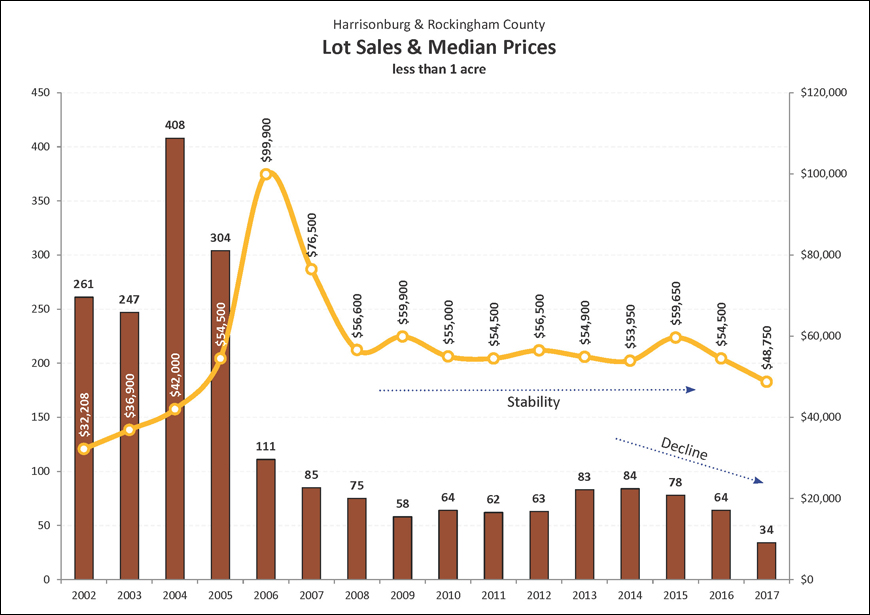
After some modest recovery in the pace of sales of lots of less than an acre over the past few years, there were fewer of these sales in 2016 (64) as compared to 2015 (78) and 2014 (84). That slowing pace of lot sales did not stop sellers in 2015 from being able to obtain higher prices for their building lots with a median sales price of $59,650 -- but that median price then declined during 2016 to only $54,500. Despite the lack of increase in lot sales, we are seeing quite a bit of stability in the median sales price, which has bounced around between $54,000 and $60,000 since 2008 and continuing through 2016.
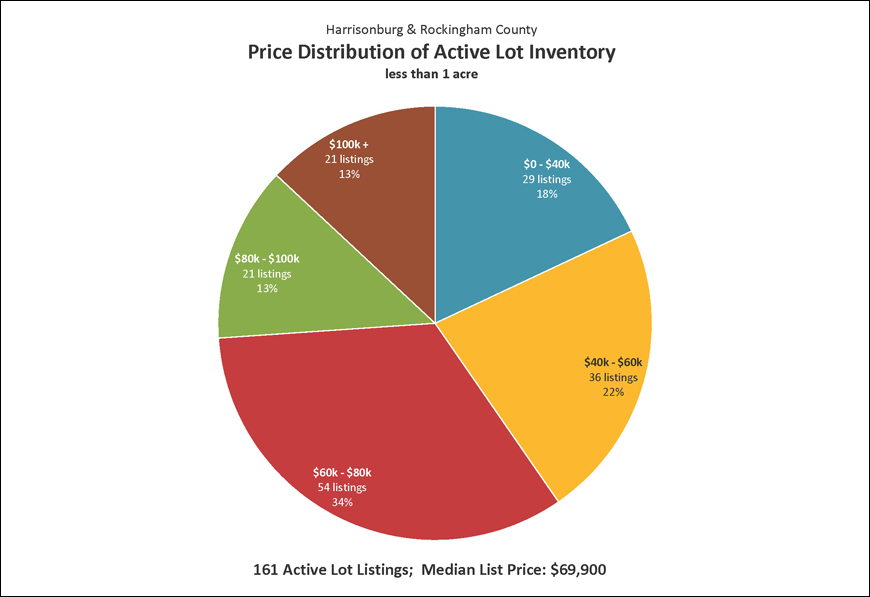
Despite the fact that only 64 lots (of less than an acre) sold in all of 2016, there are a remarkable 161 lots currently for sale. Some sanity exists in this listing market, however, as the median list price of lots for sale ($69,900) is not too much higher than the 2016 median sales price of $54,500. Given last year’s 64 lot sales, if no other lots were listed for sale, it would take 2.5 years to sell all of the lots currently listed for sale. As you can see above, a significant portion of the lots currently listed for sale are priced above $60,000 --- thus many sellers have offering prices higher than recent (2011-2016) median sales prices.
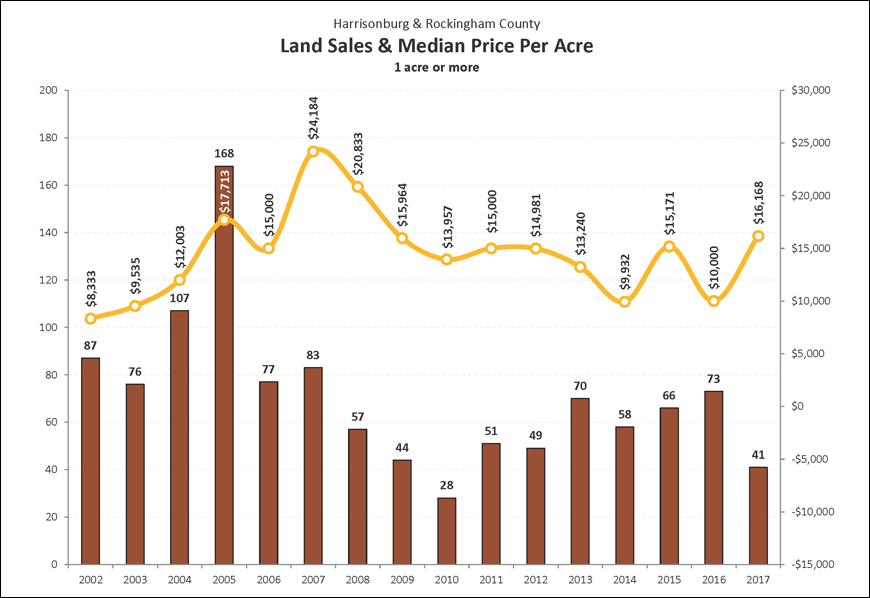
Parcels of land larger than one acre in Harrisonburg or Rockingham County increased in pace during 2016 to 73 land sales -- marking the highest year of sales since 2007. That said, during that same timeframe, the median price per acre has fallen from $24,184 (in 2007) down to $10,000 (in 2016). Some aspects of this “median price per acre” calculation are affected by which parcels actually sell in a given year, but it is clear that land prices have been trending slowly down over the past five or so years. We will likely need to see more buyer activity (demand) before we will see any meaningful increases in the median price per acre.
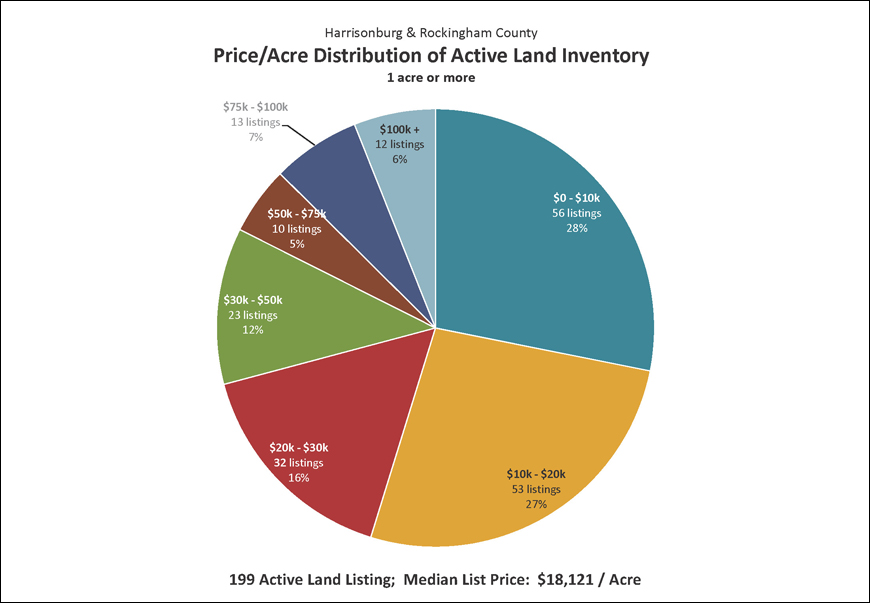
Despite the fact that only 73 parcels of land (of one acre or more) sold in all of 2016, there are a remarkable 199 parcels of land currently for sale. Furthermore, despite the fact that the median sales price of land is hovering around $10,000 per acre, the median list price of the 199 parcels for sale is currently $18,121 per acre. Given last year’s 73 land sales, if no other land is listed for sale, it would take 2.7 years to sell all of the parcels of land currently listed for sale. As you can see above, the vast majority of land listed for sale is listed at median prices per acre well above the median sales price per acre.
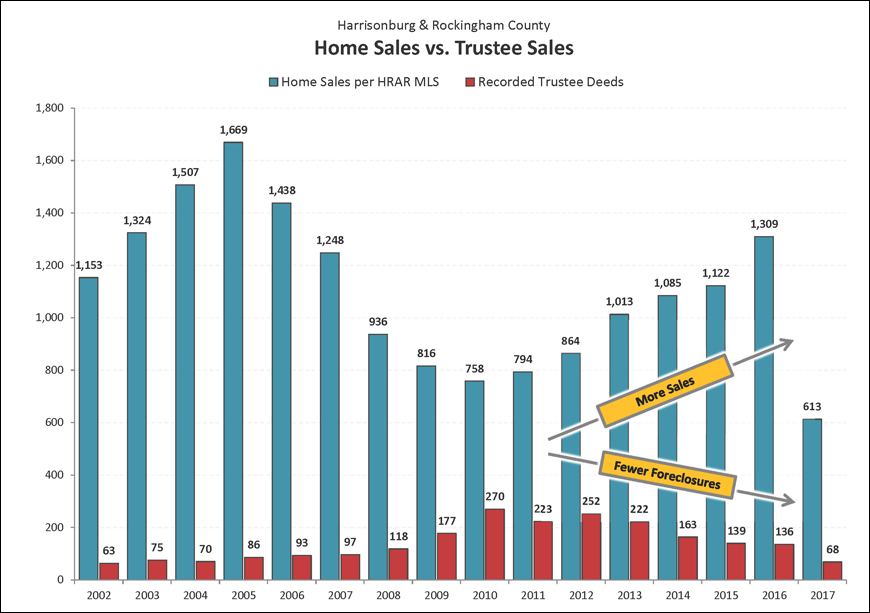
The graph above is a comparison of two imprecise measures -- but the comparison can still be helpful. The blue bars show the number of home sales recorded in the HRAR MLS -- this does not include private sales that did not involve a Realtor, nor new home sales directly from a builder. The red bars show the number of recorded Trustee Deeds. Some foreclosed properties then show up again as REO properties. The foreclosure rate in our local market area is definitely trending downward, as there were 6.7 times as many home sales as foreclosures in 2014, 8.1 times as many home sales as foreclosures in 2015 and 9.6 times as many in 2016.
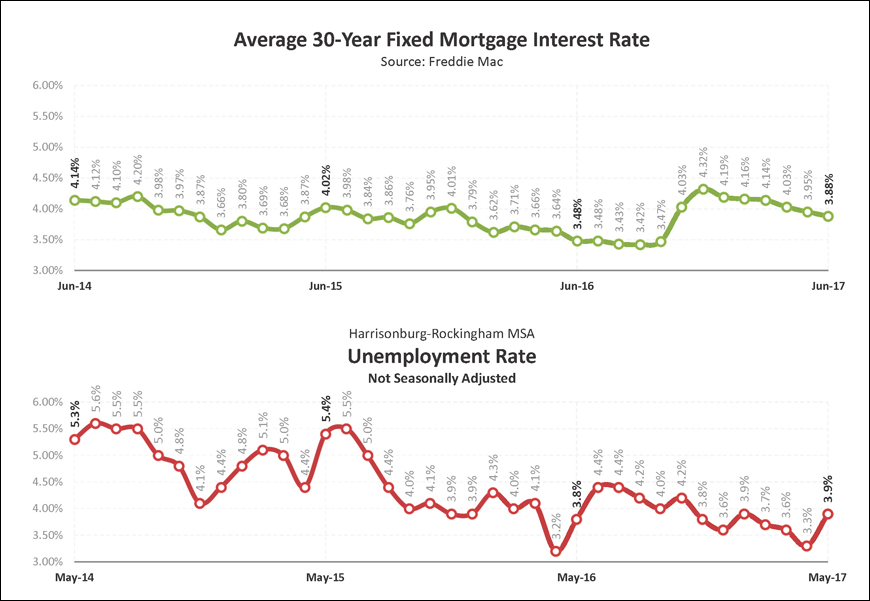
As shown in the top graph above, for most of the past three years, home buyers have seen tremendously low interest rates -- almost always under 4%. After jumping up above 4% in early 2017, interest rates have been slipping down for the past few months, and now are back down to just below 4.0%. The second graph above illustrates trends in the local unemployment rate -- which has shown a general downward trend over the past several years. A low local unemployment rate and relatively low mortgage interest rates continue to help our local housing market remain stable and start to grow in recent years.