
A service of Scott P. Rogers, Associate Broker, Funkhouser Real Estate Group 540.578.0102 | scott@HarrisonburgHousingToday.com
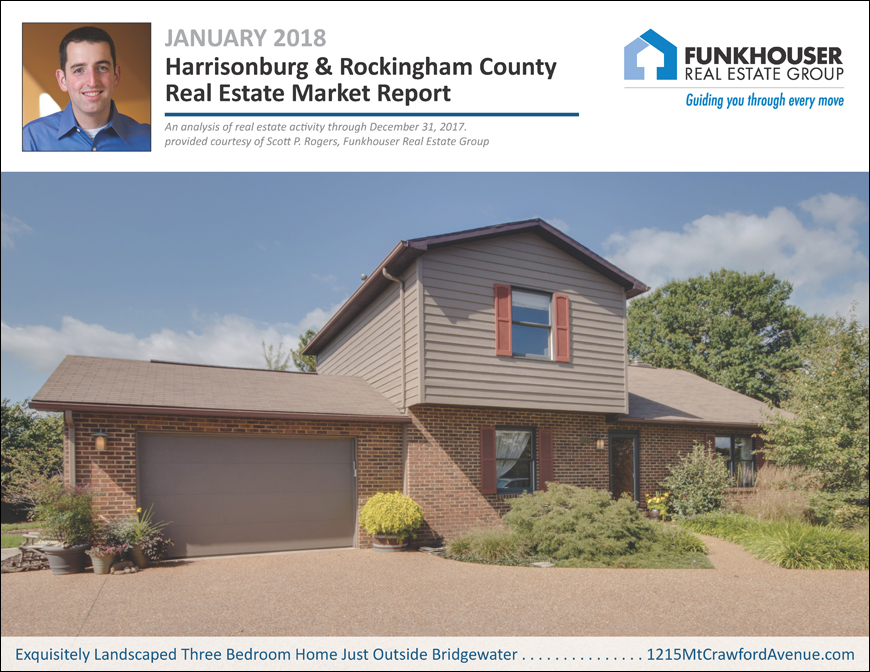
January 2018 Harrisonburg & Rockingham County Real Estate Market Report
January 11, 2018
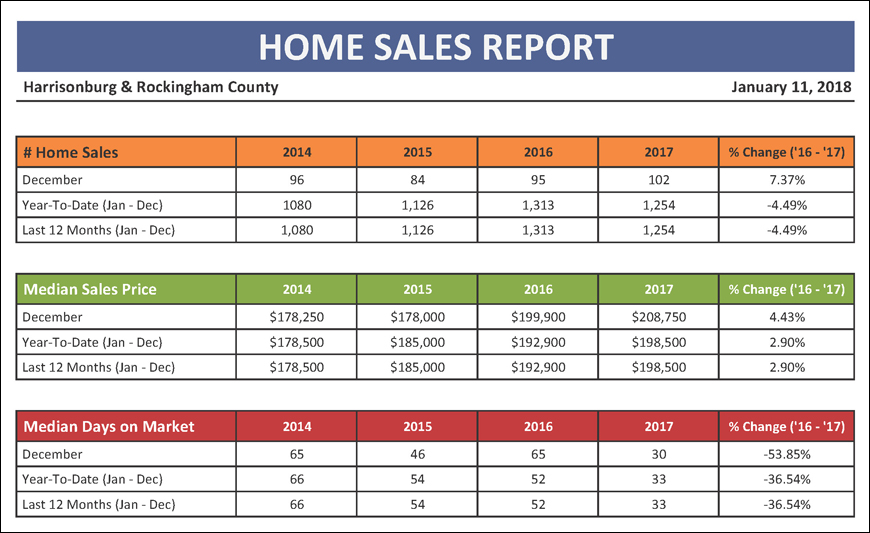
December 2017 was a brick month of home sales in Harrisonburg and Rockingham County -- with 102 sales to finish out the year -- more than any of the prior three months of December. This brought our annual total to 1,254 home sales, which is 4% fewer home sales than seen last year -- though 11% more home sales than seen in 2015. The median sales price in 2017 finished the year at $198,500 -- marking a 3% improvement over the past year, and the third year in a row of steady increases in sales prices. Homes also sold QUITE quickly in 2017 with a median “days on market” of 33 days -- down 37% from last year.
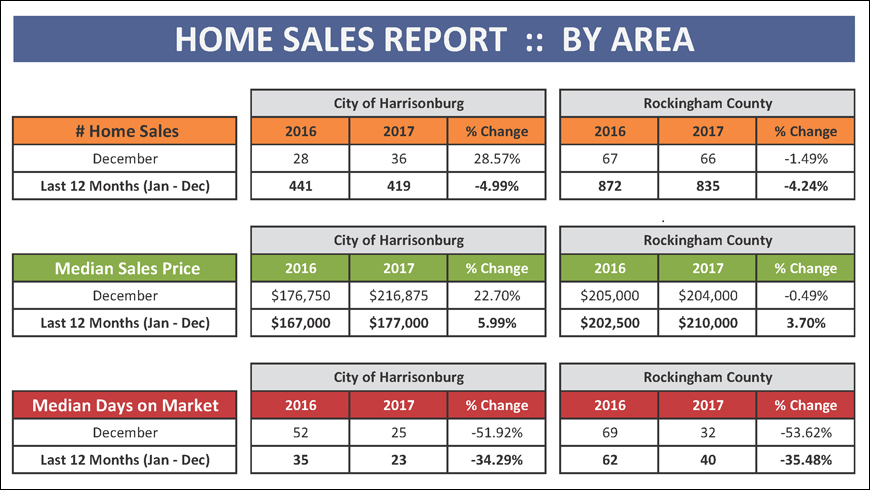
Each year, twice as many (+/-) homes sell in the County as compared to the City, and 2017 confirmed that pattern yet again with 419 City home sales compared to 835 County home sales. The pace of sales declined 5% in the City and 4% in the County, but the median sales price increased in both areas. Prices rose a bit more quickly in the City (6%) though to a lower median sales price of $177,000 -- as compared to the 4% rise in median prices in the County to $210,000. Homes sold more quickly in the City (median of 23 days on market) than in the County (median of 40 days on market) as has been the trend in recent years.
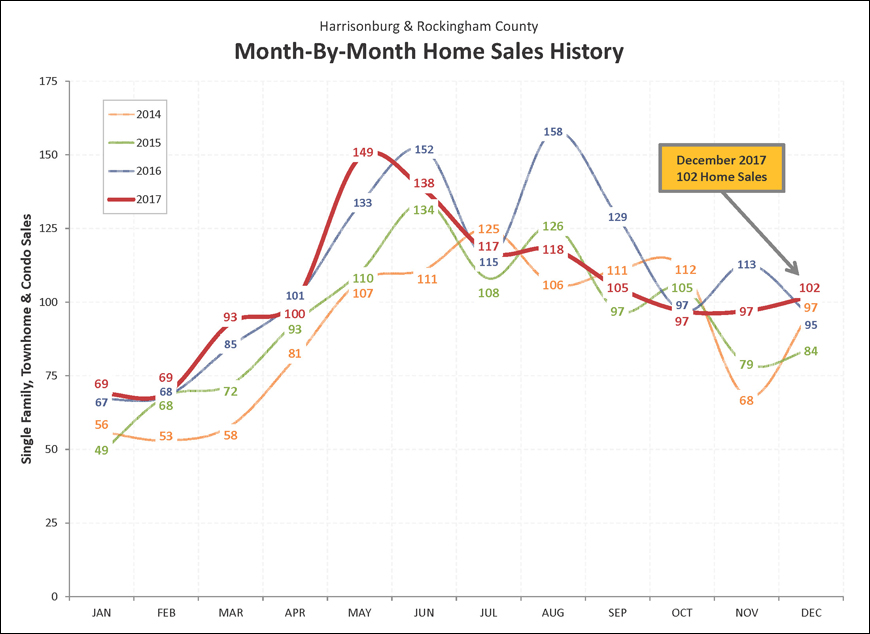
This year has not had the sky high monthly sales figures seen last year. As shown above, last August, September and November (all of 2016) were spectacular months of sales -- well above and beyond any previous such months in recent memory. This year, the months of August, September and November fell right in the middle of (or above) 2014 and 2015 sales paces for those same months. We did close out the year with the best December that we have seen in several years, which helps the year of home sales round out nicely. We are likely to see relatively low (sub-80) months of home sales in January and February of 2018.
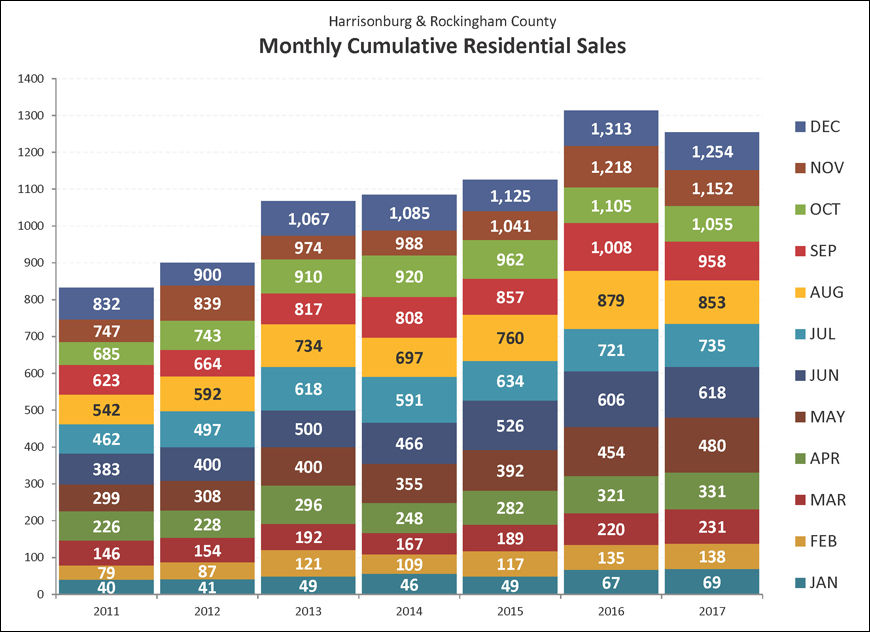
This colorful graph offers another way to look at the overall sales trends for the past few years in the Harrisonburg and Rockingham County housing market. As shown above, our local housing market experienced small incremental growth between 2013 and 2015 before seeing a sharp uptick in home sales last year in 2016. Through July of this year, it seemed that we would see more home sales in 2017 than in 2016 -- but we have since fallen quite behind! Slower months of home sales in this past Fall and early Winter resulted in a net loss in total home sales when comparing 2017 to 2016.
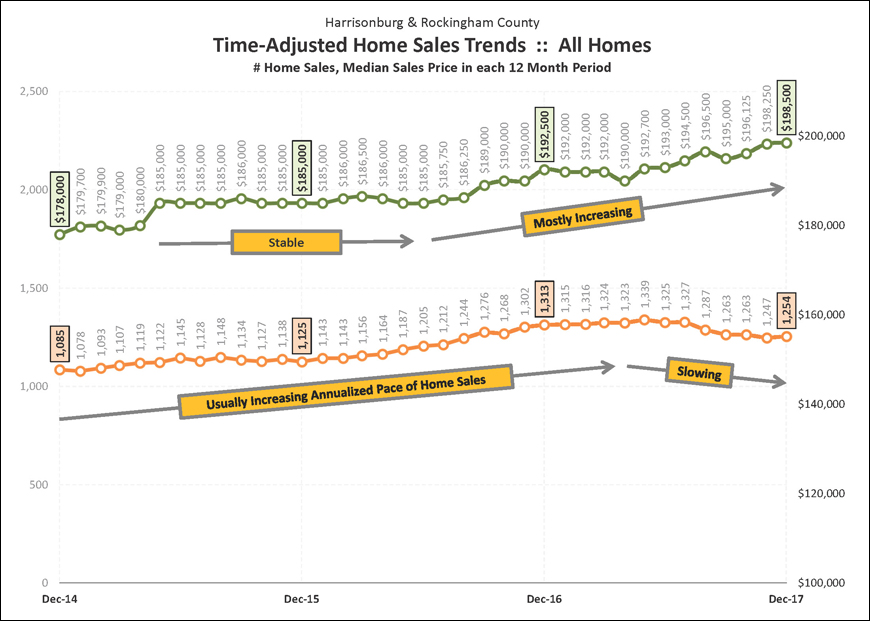
This graph shows a rolling 12 month trend line of the number of homes sold in the Harrisonburg and Rockingham County area, as well as the median price of the homes that sold during these time frames. Each data point shows one year’s worth of home sales, which eliminates the volatility of evaluating sales figures on a monthly basis. Over the past three years we saw relatively consistent increases in the annual pace of home sales up until August 2017, when the pace of sales started slowing down. The median sales price has been steadily increasing for a year and a half and is now nearing $200,000.
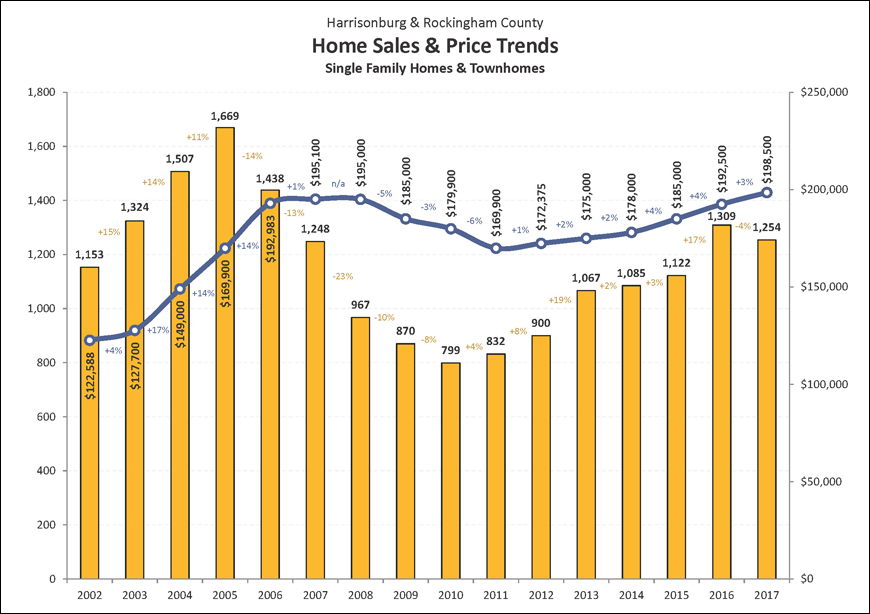
This graph provides an overall indicator of the state of our housing market, showing both the number of homes being sold each year since 2002 (yellow bars) as well as changes in the median sales price during the same time period (blue line). After six years in a row (2011-2016) of an increasing pace of home sales, we then saw a 4% decline in the pace of home sales in 2017. This was accompanied, however, by a 3% increase in the median sales prices, which continues the now six year (2012-2017) trend of increasing median sales prices, and we have now reached the highest annual median sales price ever seen in Harrisonburg and Rockingham County.
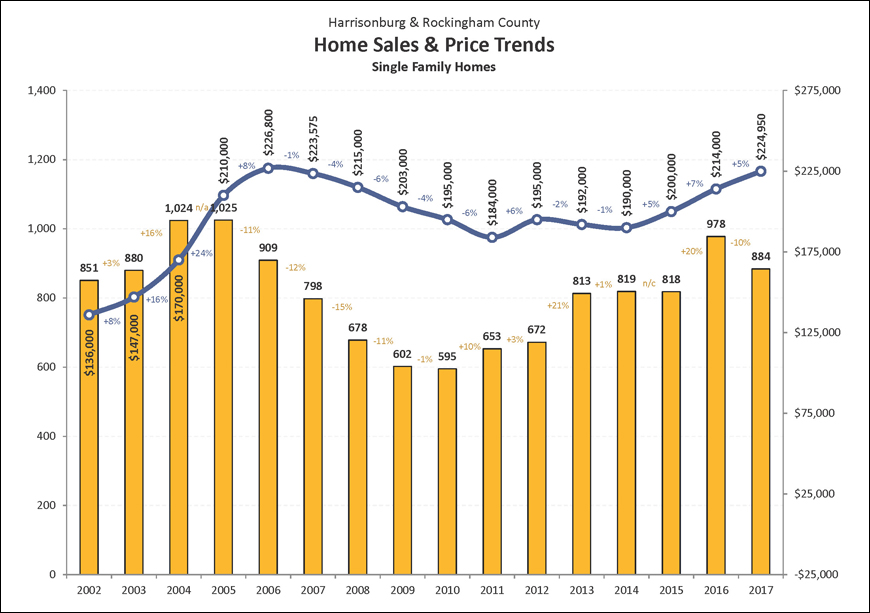
The single family home market in Harrisonburg and Rockingham County improved significantly between 2015 and 2016 with a 20% increase in the number of homes sold and an accompanying 7% increase in the median price of those homes. Last year proved to be a bit of a different year -- with a 10% decline to only 884 homes selling in the year -- though the median sales price continued to rise, from $214,000 up 5% to $224,950. This brings us very close to the highest annual median sales price for single family homes -- which is currently the median of $226,800 seen in 2006. It only took eleven years to (almost) get back to that level.
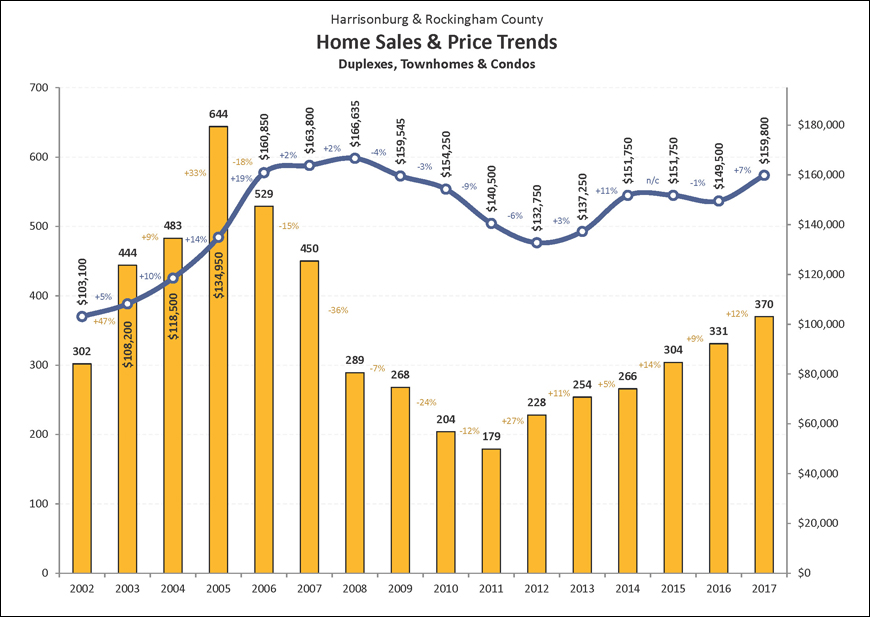
Townhouse (and duplexes and condo) sales are on a roll! Last year marked the sixth year in a row that we have seen an increase in the number of these sales in Harrisonburg and Rockingham County, with 370 sales -- up 12% from last year. In even better news, the median sales price of these townhouses, duplexes and condominiums has risen 7% over the past year from $149,500 up to $159,800. We still have not returned to the peak median sales price seen in this property category between 2006 and 2008, and we are likely never (or not for a long while) to see a return to over 600 of these sales per year, as was seen in 2005.
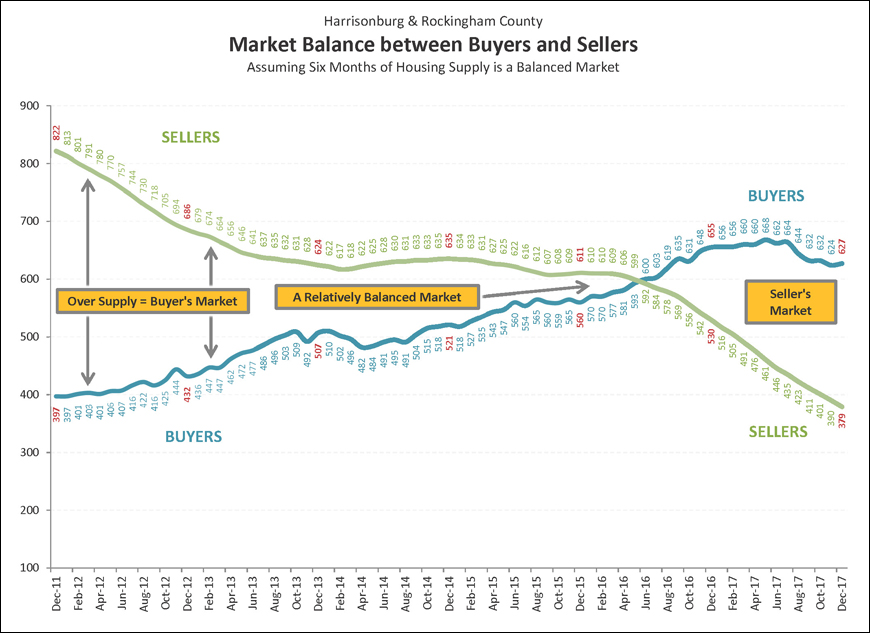
Most housing market analysts consider six months of inventory (active listings) to be an indicator of a balanced market (between buyers and sellers). The “BUYERS” trend line above is illustrating how many buyers are buying in a six month period. The “SELLERS” trend line above is illustrating how many sellers are in the market (active listings) at any given time. Over the past four years we have seen a steady increase in buyers and a declining number of sellers. In June 2016, these two trajectories crossed, and there are now many more buyers buying in a six month period than there are homes for sale -- though the pace of buying activity is slowing.
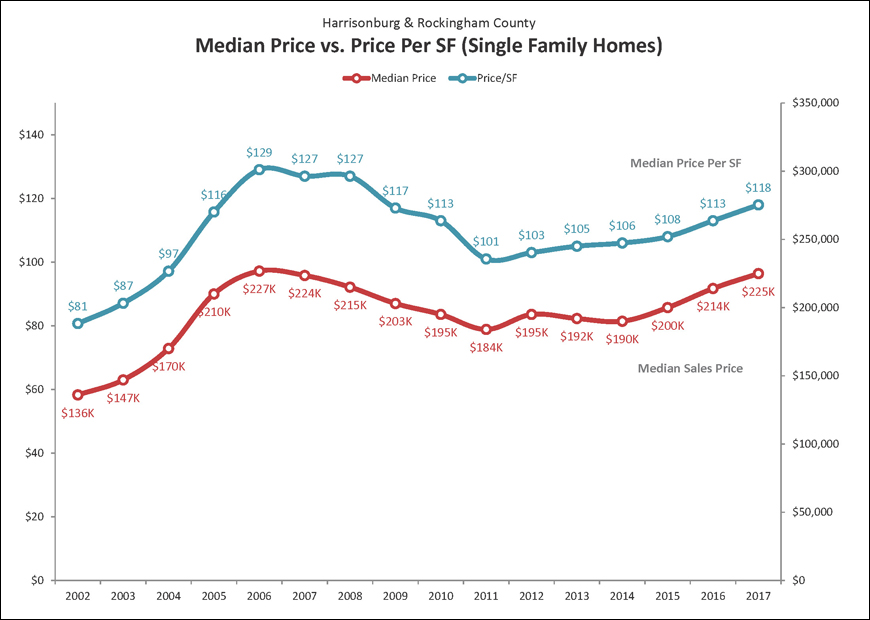
In addition to monitoring home values by overall median sales prices in our market, it can be insightful to examine the median price per square foot of homes that are selling. The graph above shows the median price per square foot of all single family homes sold over the past 10+ years. The value trend captured by this graph is quite similar to the trend shown in the single family home median sales price during the same time, which validates that assumed set of changes in home values. Over the past year+ (2015 to 2016 to 2017) we have seen increases in both the median sales price as well as the median price per square foot of single family homes.
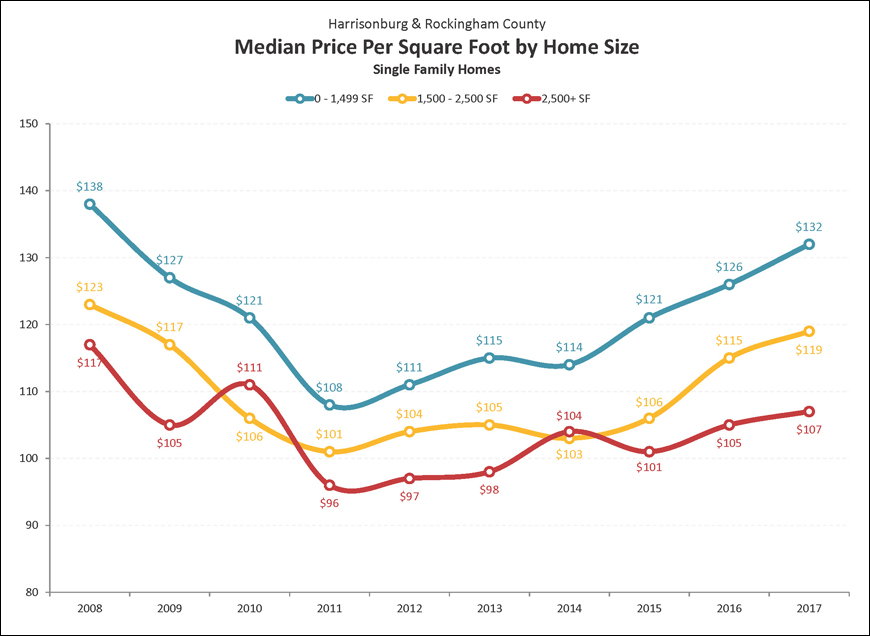
Price per square foot of single family homes certainly varies for many reasons, including the age, location, lot size and structural characteristics of each home sold. However, there are some similarities in homes of similar sizes. Looking at 2017 figures, this graph illustrates that the median price per square foot of larger homes (2500+ SF) is a good bit lower ($107/SF) than that of homes with less than 1500 SF ($132/SF). These values cannot be used as an absolute standard against which the value of any home can be measured, but they can provide some helpful guidance when trying to determine the value of a home.
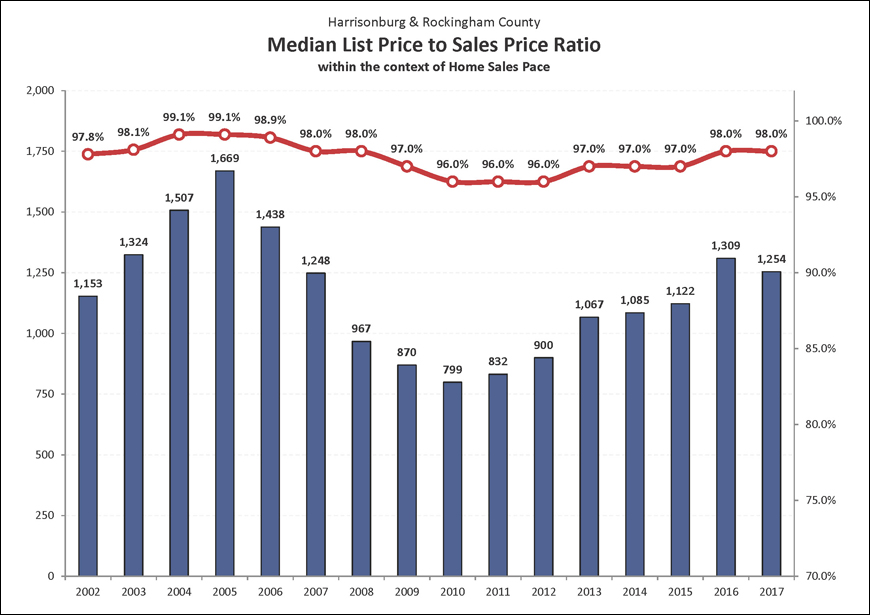
This graph shows the average list price to sales price ratio (red line) over the past 15 years as compared to the overall pace of home sales. At the peak of the housing boom (2004-2006) sellers were able to obtain a median of 99% of their asking price --- up from a median of 97.7% in 2001 before the pace of home sales started escalating. Then, when the pace of home sales slowed (through 2010) we saw a decline in this metric to 96%, where we stayed for three years (2010, 2011, 2012). Sellers started selling for slightly more in 2013-2015 when they could obtain 97% of their list price. This increased to 98% in 2016 and held steady in 2017.
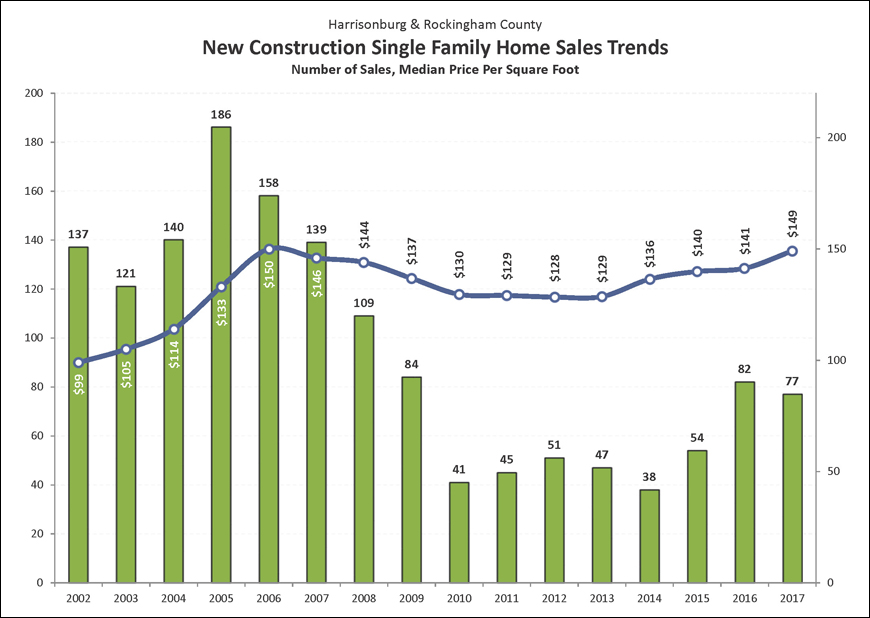
New home builders experienced a steady decline in new home sales between 2005 and 2010 -- dropping 78% from a peak of 186 to 41 sales in a year. Even if we use a starting point of 2001 (not shown above; before the housing boom) we still find a 70% drop between 2001 and 2010. The number of new home sales per year has not crept up much since that time -- staying between 38 and 54 new home sales per year. The past two years, however, were QUITE different. There were a total of 82 new home sales in 2016 and 77 more in 2017 -- a welcome sign for new home builders as we look ahead to 2018.
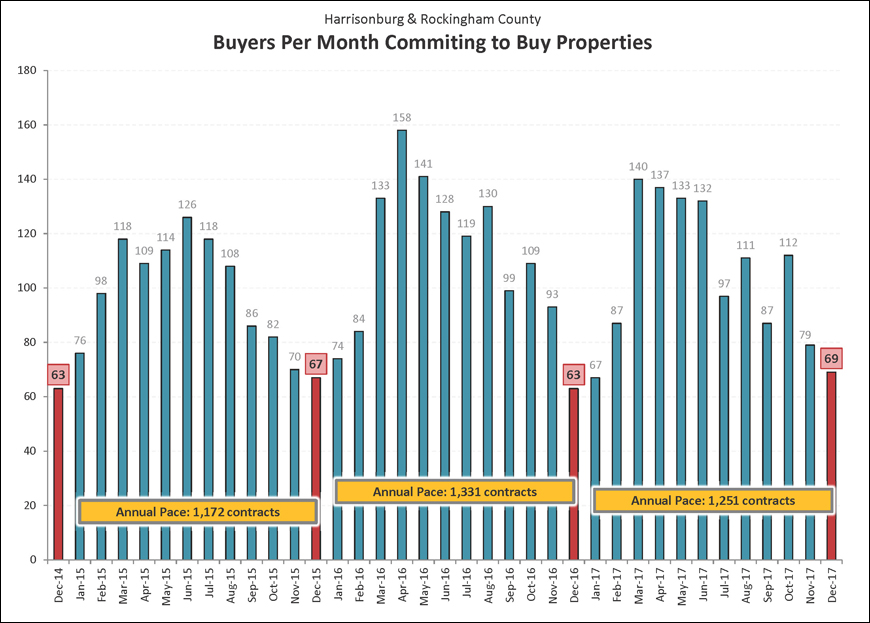
Strong contract activity is typically an indicator of strong months of sales to come. Last year was a bit of a mixed bag -- we started off strong in March, April, May and June and then things slowed down into the late Summer and Fall months. We did see a bit of an increase in October, then slower contract activity in November, and then a bit of a bump again in December. I believe restricted inventory levels are one of the biggest limitations on the number of homes that are going under contract. Looking ahead, we are likely to see at least one more month of rather slow contract activity, and then things could start to speed up as soon as February.
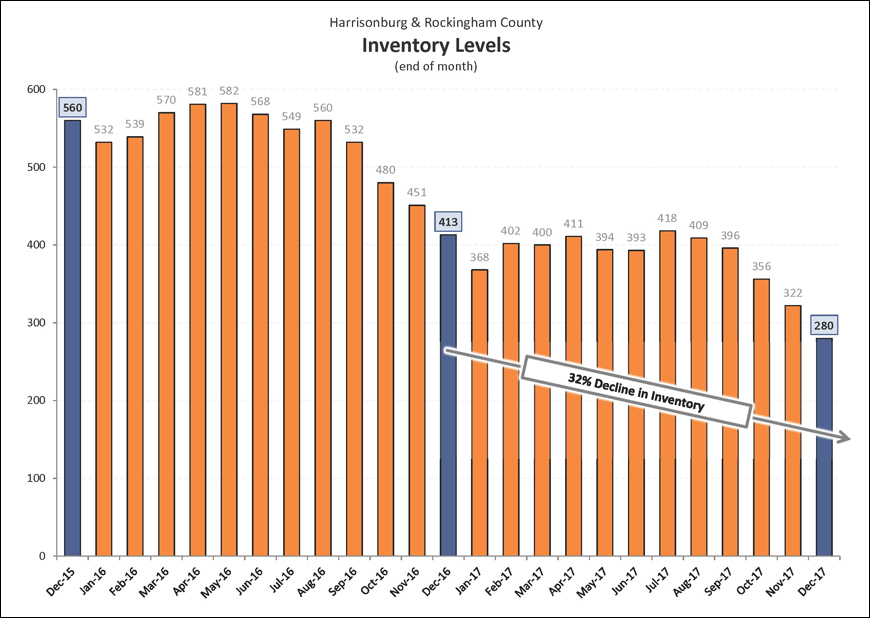
Overall sales activity is the combined effect of many would-be home buyers deciding to make an offer on a particular home -- and those decisions are not typically taken lightly. In contrast, changes in inventory levels are the effect of many homeowners deciding to list their home for sale -- which may be a significant decision, but it is not always so. Some homes that are on the market have been listed for sale by sellers who are “testing the market” and as a result, inventory levels can shift more quickly than home sales trends. Inventory levels have been declining drastically over the past year -- and are now 32% lower than they were one year ago.
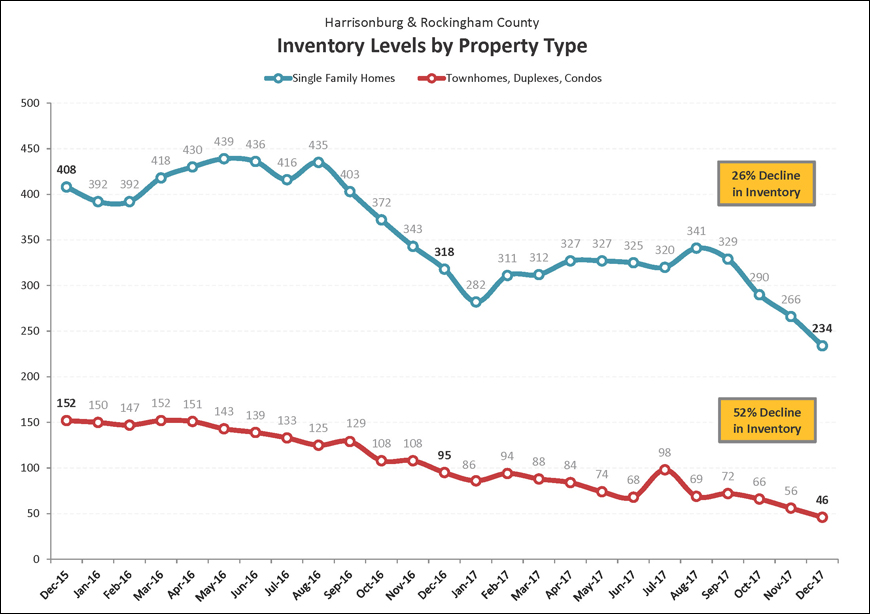
This graph examines the differences in inventory levels over time when examining only single family homes as compared to attached dwellings (townhouses, duplexes, condos). The number of single family homes for sale has decreased by 26% over the past year, while the number of townhouses, duplexes and condos for sale has decreased by a startling 52% over the past year! All we can hope is that these inventory levels will start to climb again (??) at some point -- maybe next Spring!?! There are many buyers in our local market who are anxious to buy, but not finding many properties that they would like to purchase.
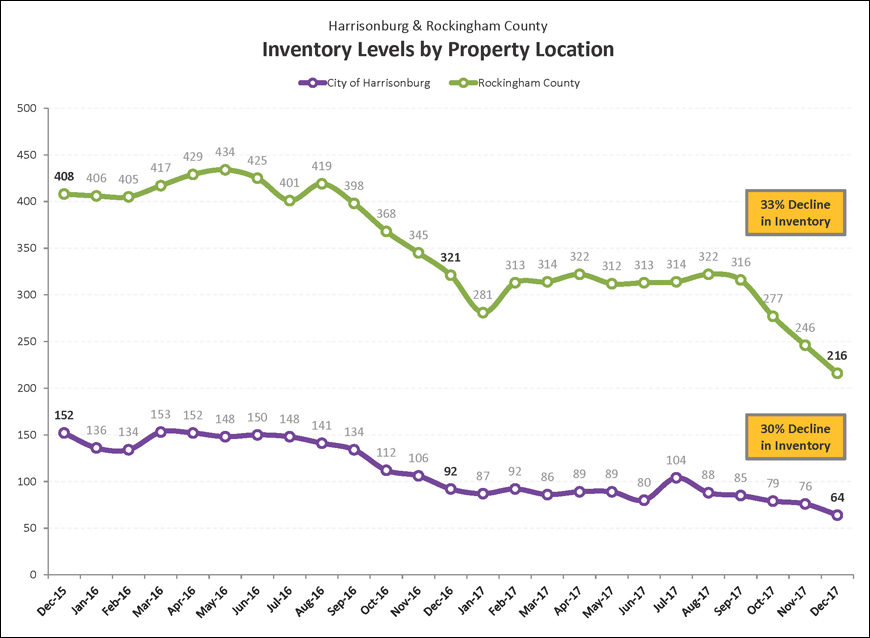
Inventory levels have been falling in both the City and County over the past two years, with a 30% and 33% decline in each region, respectively. Of note -- while there are approximately twice as many home sales in the County than in the City -- there are more than three times as many homes for sale in the County than in the City. As such, the low inventory is much more of an issue in the City right now if we look at both sellers (supply) and buyers (demand). I would like to say that we should see inventory levels start to increase again next Spring, but that does not seem to be a certainty given trends over the past year.
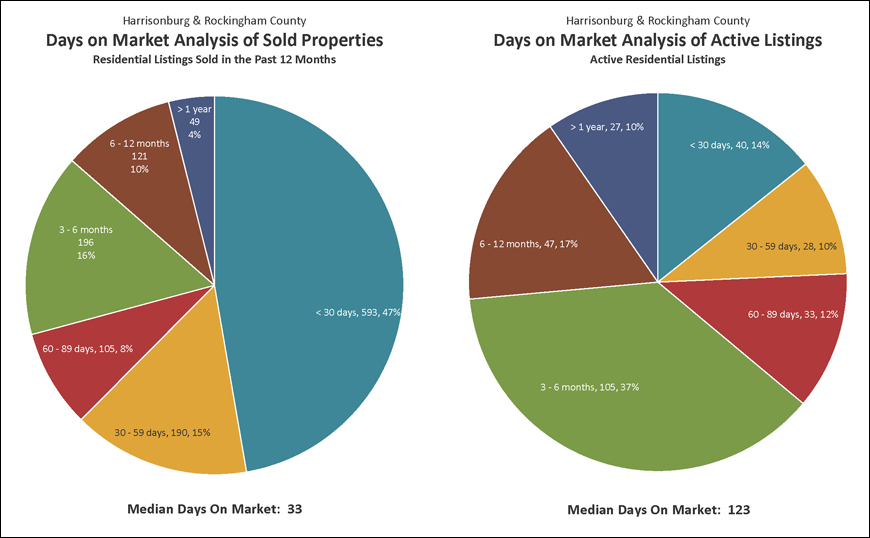
Declining inventory levels are contributing to an overall decline in the time it takes to sell a home in Harrisonburg and Rockingham County. The current median “Days on Market” is 33 days for homes that have sold in the past year. Remarkably, 47% of homes that have sold in the past year have gone under contract within 30 days of having hit the market. Combine that with those that went under contract during the second month on the market, and you’ll find that 62% of homes that sell go under contract within 60 days. The graph to the right, above, shows the length of time that each active listing has been on the market for sale.
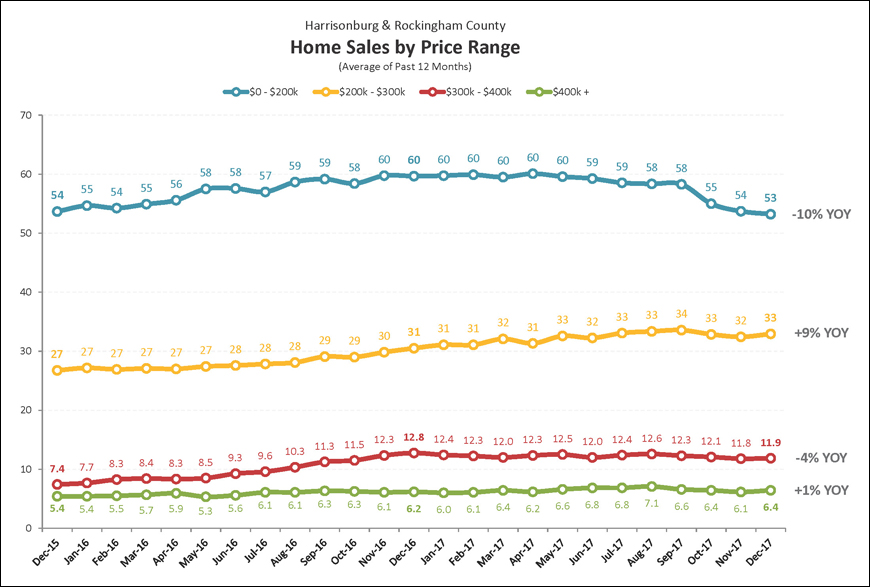
The pace of home sales in Harrisonburg and Rockingham County varies significantly based on price range. The graph above shows the average number of home sales per month (given a 12-month average) as we have passed through the past two years. Home sales have been declining over the past year in the “under $200K” category -- though likely because of limited inventory, and fewer properties existing in this range based on increasing home values. The largest increase in pace of home sales has been in the $200K - $300K price range, where sales have increased 9% over the past year.
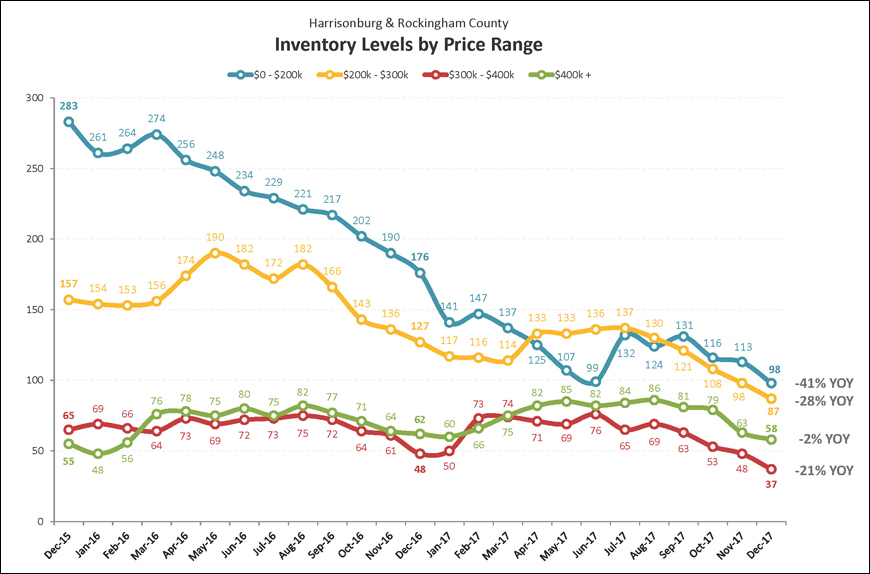
Inventory levels shift up and down seasonally, but we are also seeing differences in year-over-year trajectories in each of the four price ranges outlined above. The lowest price range (under $200K) has seen an astonishing 41% decline in inventory levels over the past year -- which is followed by a 28% decline in the $200K - $300K price range. The only price range where inventory levels have almost held steady is the $400K+ price range, where there are only 2% fewer houses on the market today as compared to one year ago. The $300K - $400K price range has seen a 21% year over year decline in inventory levels.
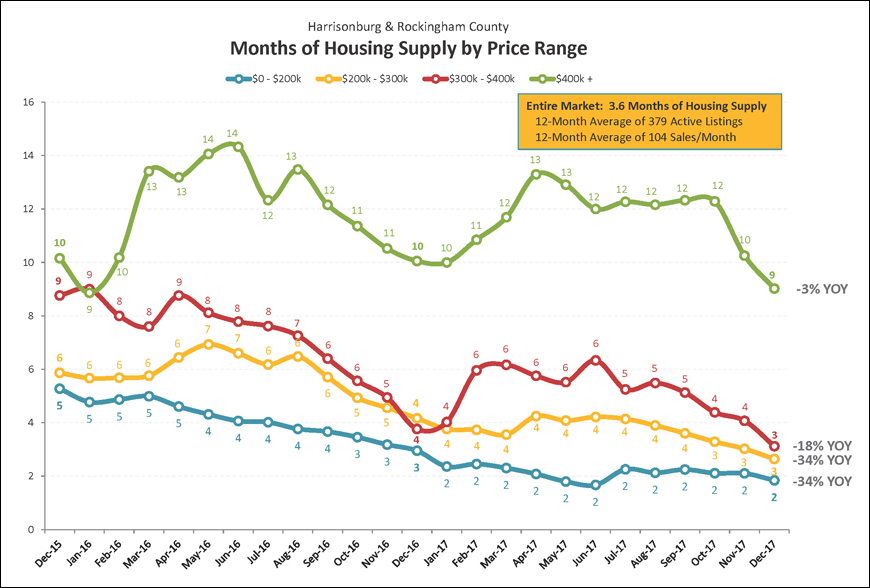
With so many home sales (lots of buyers) and so few homes on the market (not so many sellers), there are low levels of supply in some price ranges in our local real estate market. The graph above illustrates that while it would take 9 months to sell all of the homes currently for sale over $400K if the same number of buyers bought each month as have been buying (on average) over the past 12 months -- it would only take two months (!!) to burn through the under $200K inventory. Many consider a six month supply to be a balance between buyers and sellers, and we aren’t anywhere close to that in any price range under $400K.
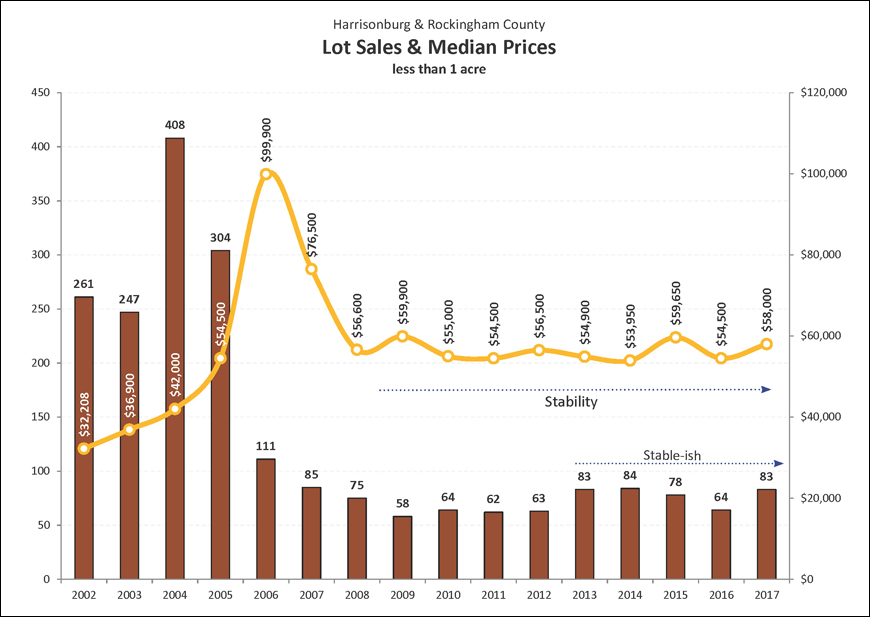
With the exception of 2016, we have seen between 78 and 84 lot sales of less than an acre for each of the past five years. This is a sharp decline from the 260 - 400 lot sales seen in 2002-2005, but it is an improvement over where things were (58-63 sales) between 2009 and 2012. From a value perspective, the sales prices of these “less than an acre” lots have also been rather stable -- fluctuating no further than between $54K and $60K over the past ten years. That is, of course, after a meteoric rise and then fall to/from $100K. Given the trajectory of lot sales over the last few years, I expect we’ll see something similar in 2018.
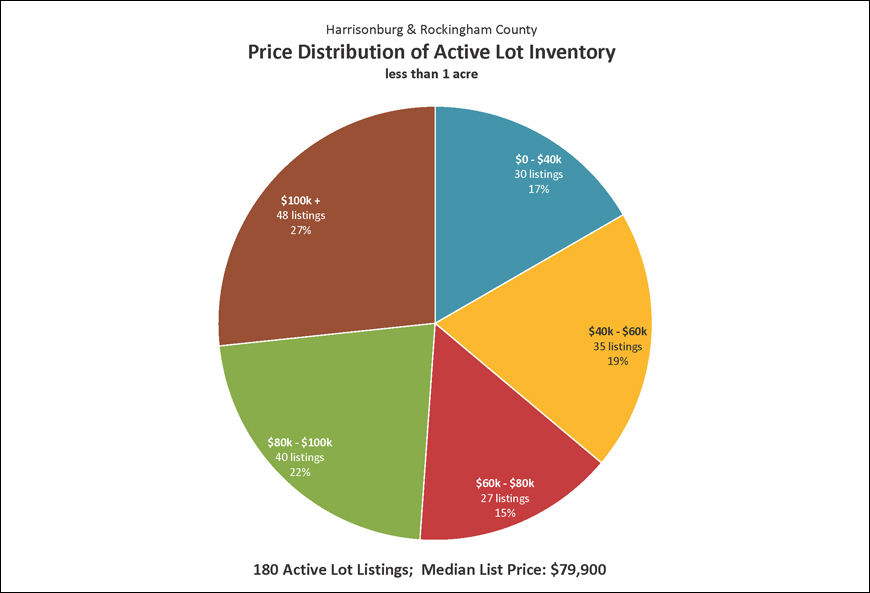
Despite the fact that only 83 lots (of less than an acre) sold in all of 2017, there are a remarkable 180 lots currently for sale. Furthermore, the median list price of lots for sale ($79,000) is considerably much higher than the 2017 median sales price of $58,000. Given last year’s 83 lot sales, if no other lots were listed for sale, it would take just over two years to sell all of the lots currently listed for sale. As you can see above, a significant portion of the lots currently listed for sale are priced above $60,000 --- thus many sellers have offering prices higher than recent (2011-2017) median sales prices.
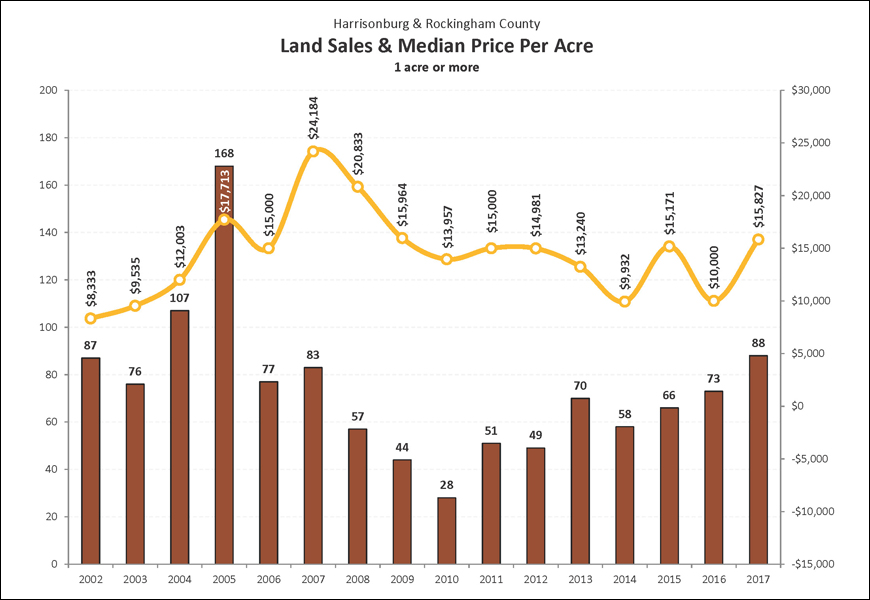
Parcels of land larger than one acre in Harrisonburg or Rockingham County increased in pace during 2017 to 88 land sales -- marking the highest year of sales since 2005. The median price per acre has also risen over the past year, from $10,000 to $15,827. That said, it was $15,171 two years ago -- so this is effectively not a net increase in price per acre over the past two years. Of note -- some aspects of this “median price per acre” calculation are affected by which parcels actually sell in a given year. We saw an increase in buyer demand in 2017, which seems to have lead to a further increase in the median price per acre.
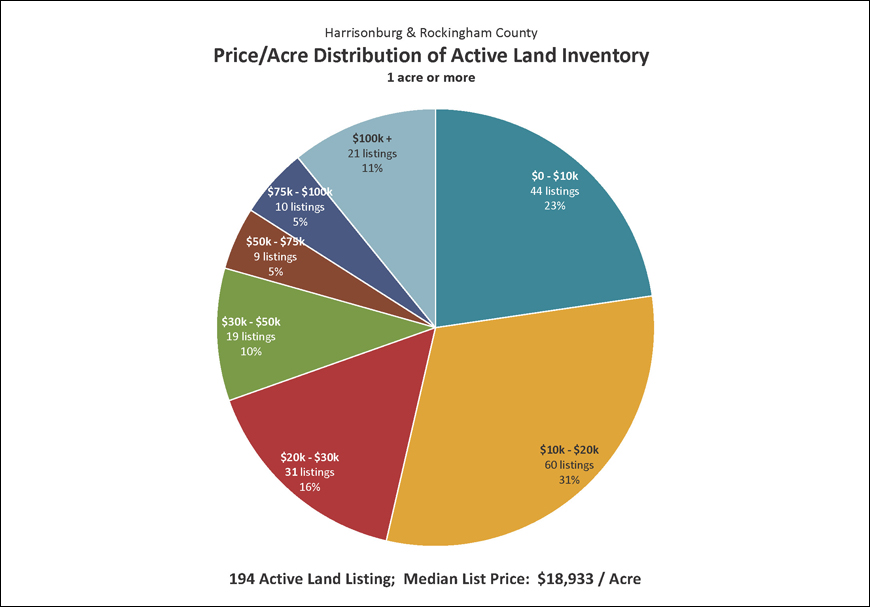
Despite the fact that only 88 parcels of land (of one acre or more) sold in all of 2017, there are 194 parcels of land currently for sale. Furthermore, despite the fact that the median sales price of land is hovering around $15,000 per acre, the median list price of the 194 parcels for sale is currently $18,933 per acre. Given last year’s 88 land sales, if no other land is listed for sale, it would take just over two years to sell all of the parcels of land currently listed for sale. As you can see above, the vast majority of land listed for sale is listed at median prices per acre well above the median sales price per acre.
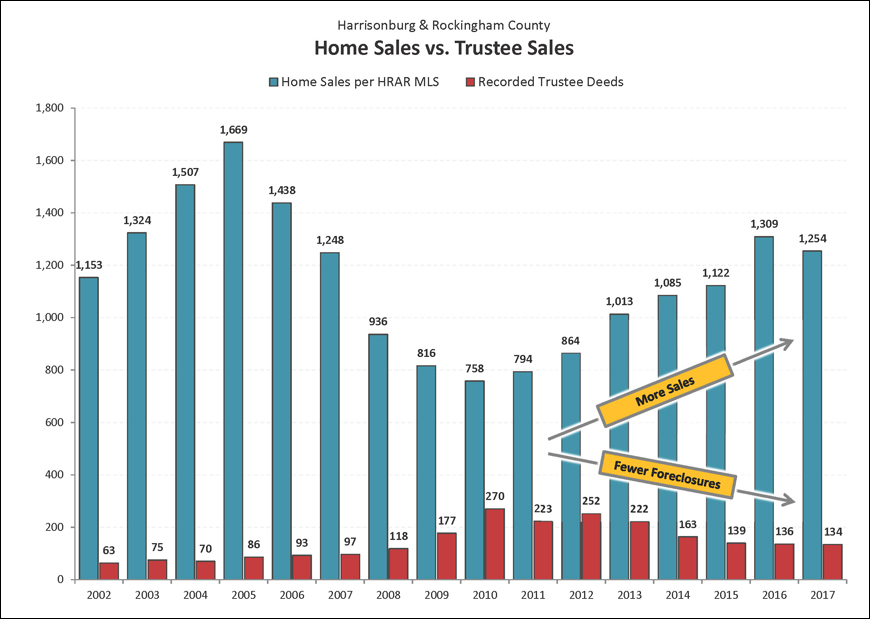
The graph above is a comparison of two imprecise measures -- but the comparison can still be helpful. The blue bars show the number of home sales recorded in the HRAR MLS -- this does not include private sales that did not involve a Realtor, nor new home sales directly from a builder. The red bars show the number of recorded Trustee Deeds. Some foreclosed properties then show up again as REO properties. The foreclosure rate in our local market area is trending downward, though very slowly, and the pace of home sales is increasing much more quickly.
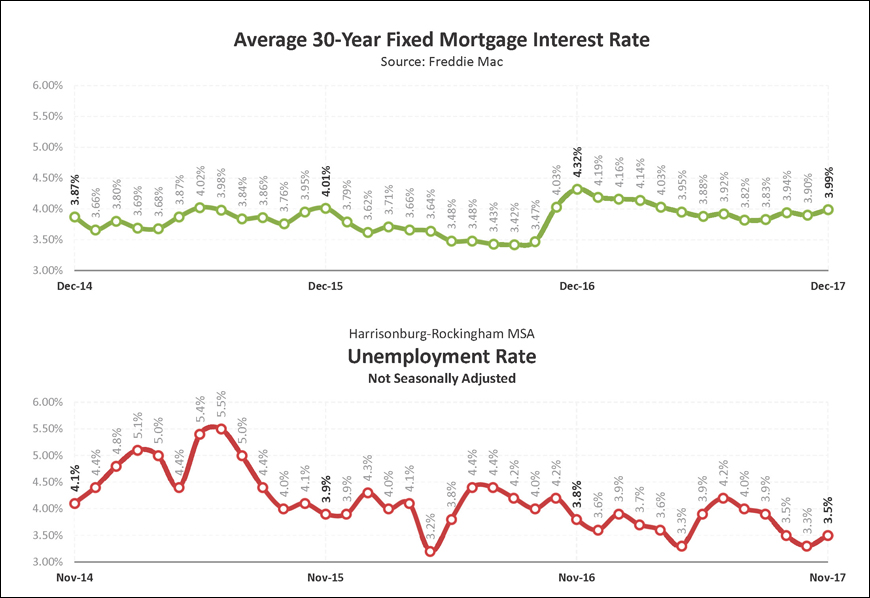
As shown in the top graph above, for most of the past three years, home buyers have seen tremendously low interest rates -- almost always under 4%. After jumping up above 4% in early 2017, interest rates have been below 4% for the past eight months. The second graph above illustrates trends in the local unemployment rate -- which has shown a general downward trend over the past several years. A low local unemployment rate and relatively low mortgage interest rates continue to help our local housing market remain stable and start to grow in recent years.