
A service of Scott P. Rogers, Associate Broker, Funkhouser Real Estate Group 540.578.0102 | scott@HarrisonburgHousingToday.com
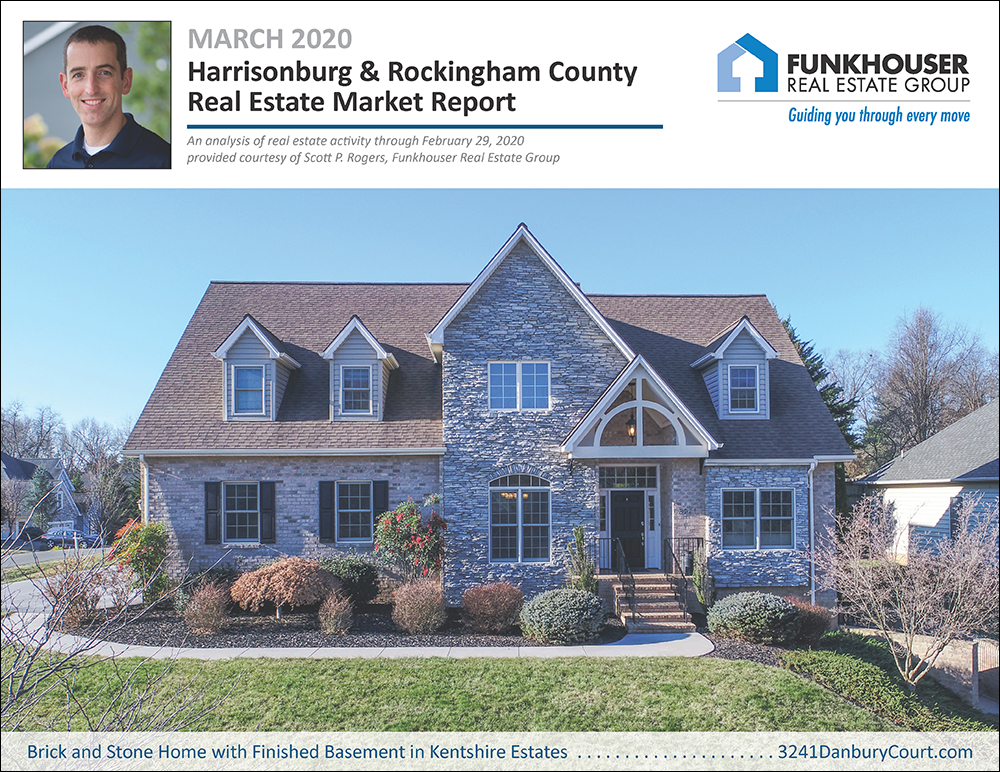
March 2020 Harrisonburg & Rockingham County Real Estate Market Report
March 11, 2020
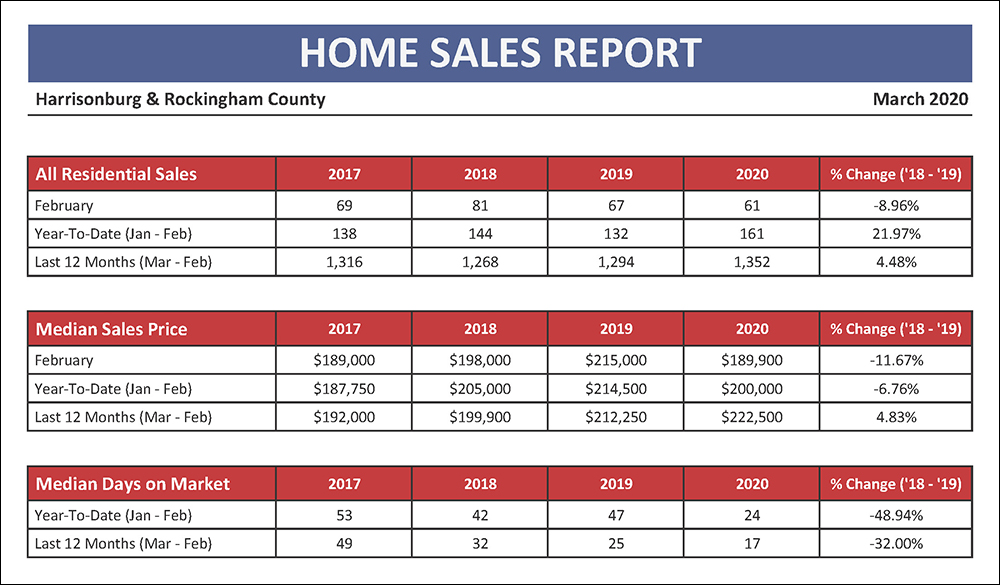
The pace of home sales slowed slightly (-9%) in February 2020 as compared to February 2019 - though annual pace of home sales (Mar-Feb) is up 4% and the year-to-date sales pace (Jan-Feb) is up 22%. Median sales prices declined 12% in February 2020 as compared to February 2020 - though the median sales price of homes over the past year ($222,500) is up 5% from where it was a year ago. Looking back over the past year, homes are still selling quickly with a 32% drop in the the median days on market - down to a median of 17 days, as compared to 25 days a year ago.
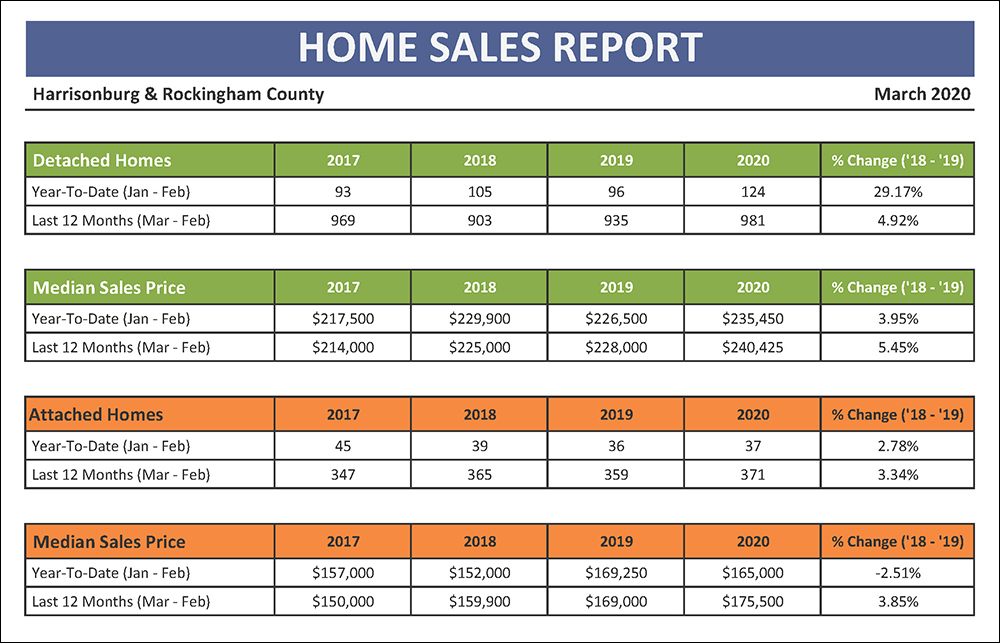
The green charts above shows trends in detached home sales -- as compared to the orange charts which show attached home sales, comprised of duplexes, townhouses and condominiums. Over the past year the pace of detached home sales has risen 4.92% to 981 sales per year, while the pace of attached home sales has only risen 3.34% to 371 sales per year. The median sales price of detached homes has risen 5.45% over the past year to $240,425 while the median sales price of attached homes has risen slightly less -- 3.85% -- to $175,500 in Harrisonburg and Rockingham County.
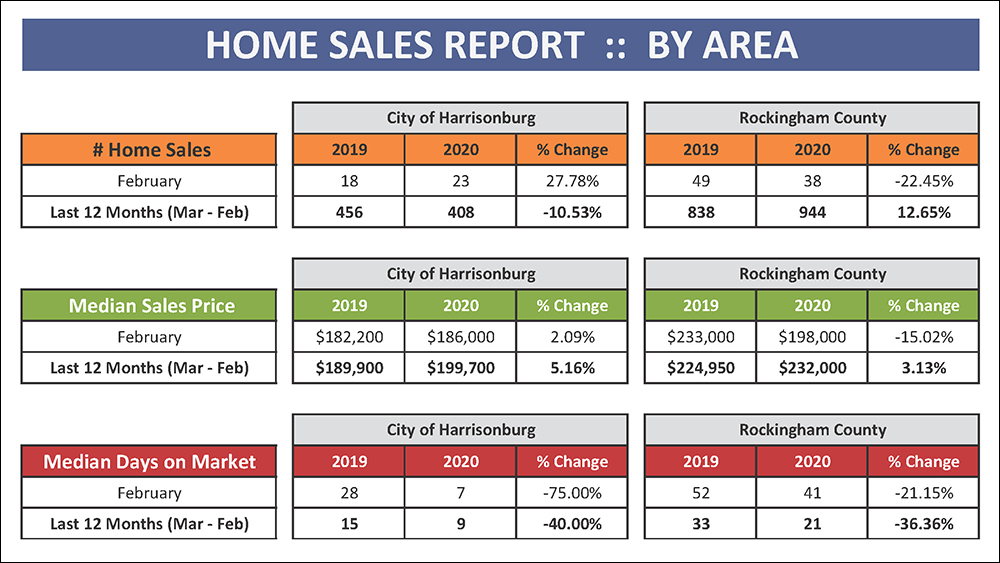
Generally, each year, more than twice as many homes sell in Rockingham County as compared to the City of Harrisonburg. Over the past 12 months, that trend continued - and we have actually seen a relatively significant decline (-10.53%) in City home sales while we have seen an almost identical increase (+12.65%) in County home sales. The median sales price of homes in the City and County have both increased - with a 5.16% increase in price in the City and a 3.13% price in the County. The median sales price is a good bit higher in the County ($232,200) than in the City ($199,700).
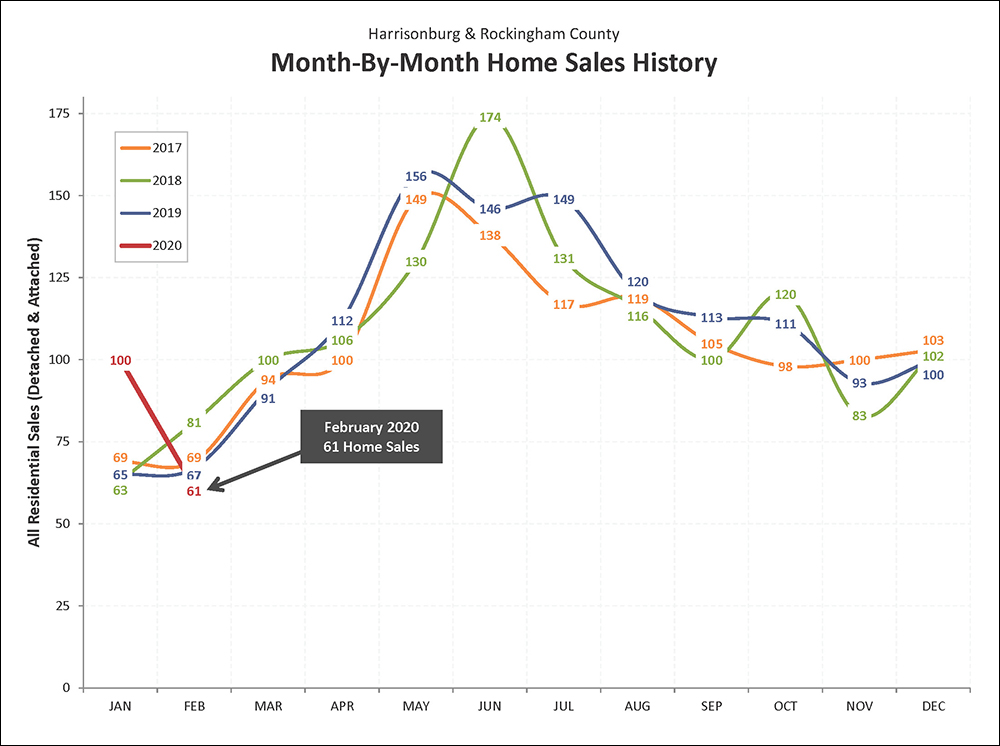
Well - if January 2020 marked the most absurdly high number of home sales seen anytime, ever, in a month of January - perhaps it was fitting that February home sales declined to the lowest month of February home sales in at least the past few years. Despite only having 61 home sales last month, the year-to-date sales pace (161 sales) is higher this year than it has been in any of the past three years. Looking forward towards March, it seems likely that we’ll see between 80 and 100 home sales in Harrisonburg and Rockingham County.
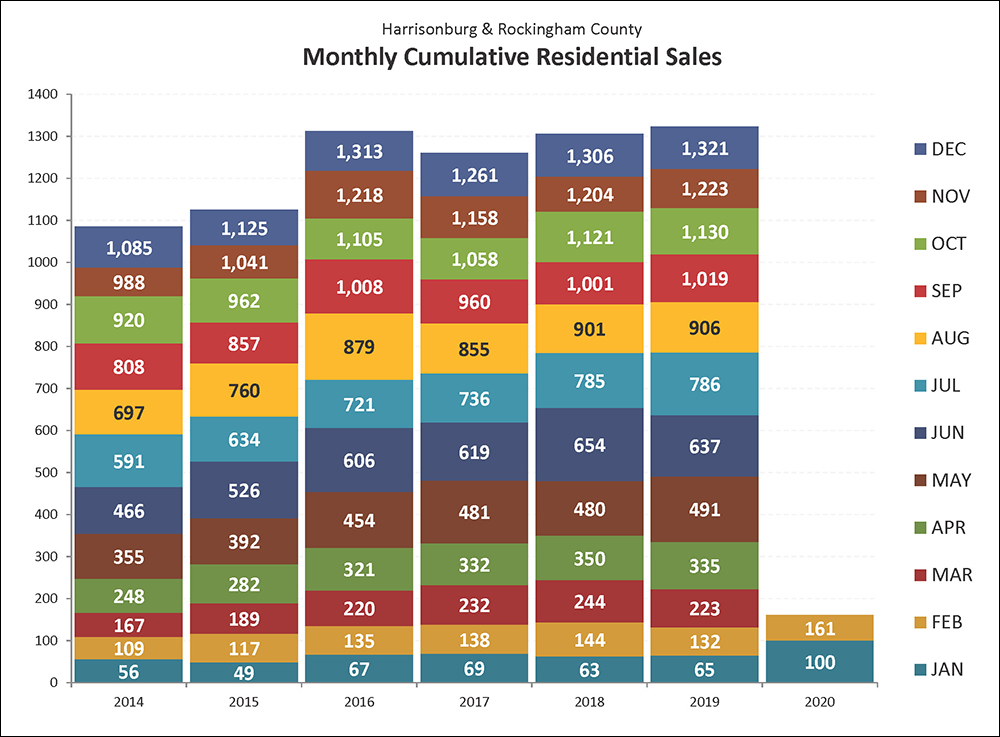
This colorful graph offers another way to look at the overall sales trends for the past few years in the Harrisonburg and Rockingham County housing market. As shown above, our local housing market experienced has seen steady growth over the past three years to a total of 1,321 home sales during 2019. This was the highest total number of home sales seen in a single year for more than a decade. And, it doesn’t seem that things will be slowing down at all in 2020 as we already have seen 161 home sales within the two months - well above what we have historically seen in a January and February.
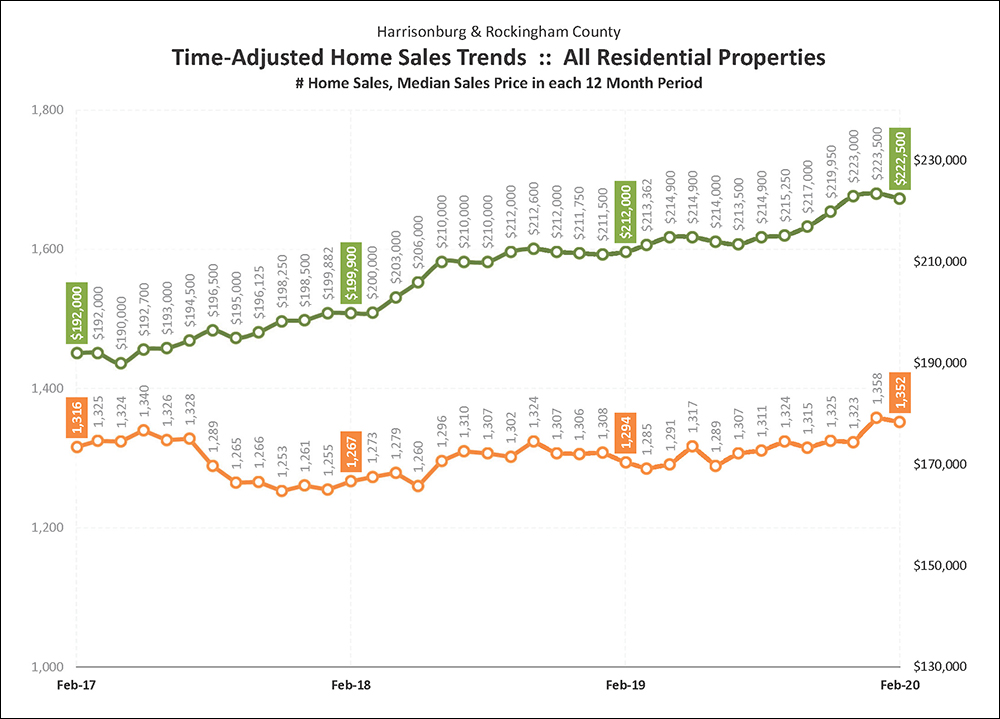
This graph shows a rolling 12 month trend line of the number of homes sold in the Harrisonburg and Rockingham County area, as well as the median price of the homes that sold during these time frames. Each data point shows one year’s worth of home sales, which eliminates the volatility of evaluating sales figures on a monthly basis. The annual pace of home sales peaked in May 2017 at 1,340 home sales -- but wait -- we have now surpassed that previous high due to a blockbuster month of sales in January 2020. The median sales price also continues to climb, having risen to $223,500 in January, and back down slightly in February.
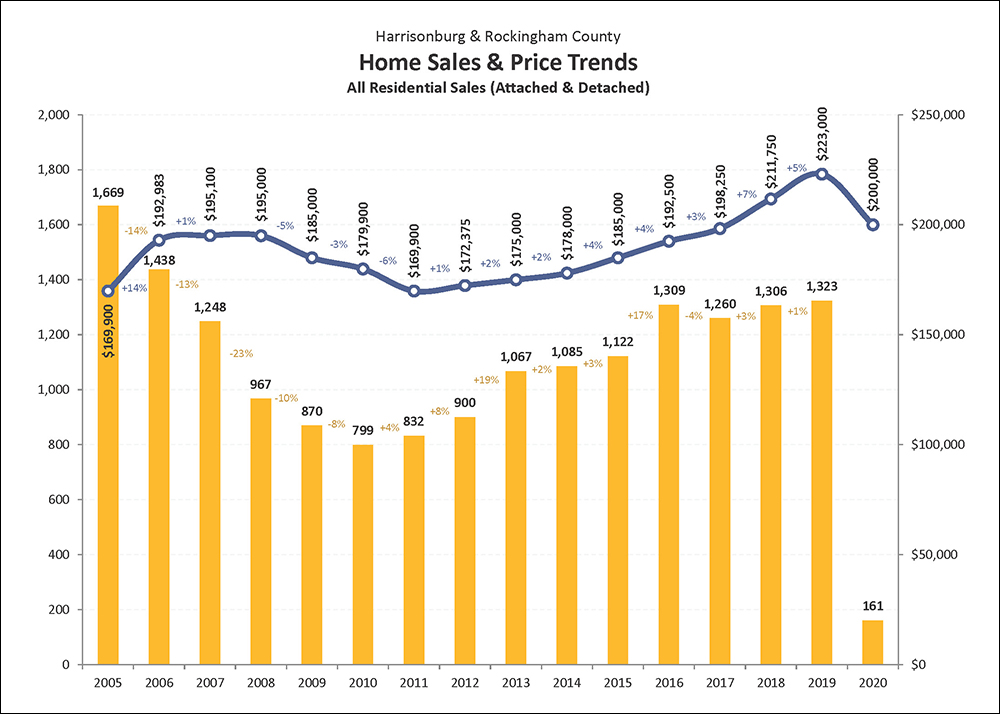
This graph provides an overall indicator of the state of our housing market, showing both the number of homes being sold each year since 2005 (yellow bars) as well as changes in the median sales price during the same time period (blue line). Over the past nine years we have seen rather steady increases in the number of homes sold each year in Harrisonburg and Rockingham County - up to 1,320 last year. The median sales price has also been consistently increasing for eight years now, up to an all time high last year of $223,000. The decline in the median sales price shown in 2020 is likely because we only have a limited number of sales thus far this year.
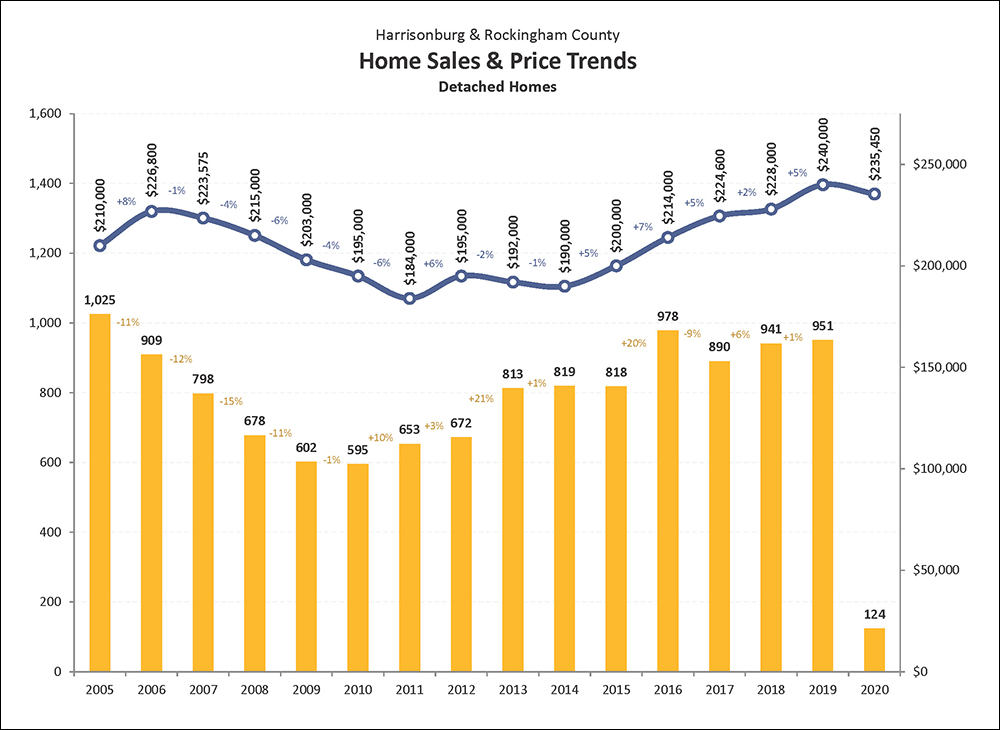
The single family home market in Harrisonburg and Rockingham County has improved rather steadily over the past nine years with increases almost every year in the number of homes sold. Technically, we saw a peak in 2016 that we have not yet matched, though there were slight increases between 2017 and 2018 as well as between 2018 and 2019. The median sales price of these single family homes has also steadily increased over the past five years -- from $190,000 to the current median sales price of $235,450.
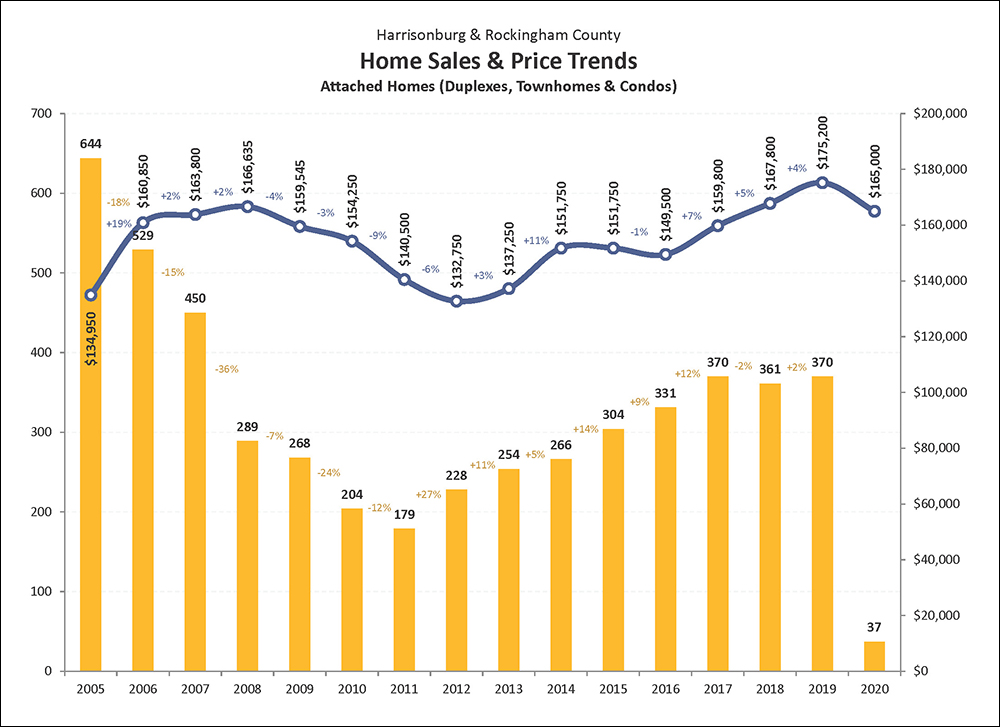
The pace of sales of attached homes (duplexes, townhouses and condos) rose steadily between 2011 and 2017 before declining slightly (-2%) in 2018 -- but then increasing slightly (+2%) in 2019. These recent years of declining numbers of sales is likely correlated to fewer new townhouses being constructed in this area. Over the past three years, the median sales price of attached homes has steadily risen to the high of $175,200 that we saw in 2019 -- the highest median sales price on record for attached homes in Harrisonburg and Rockingham County.
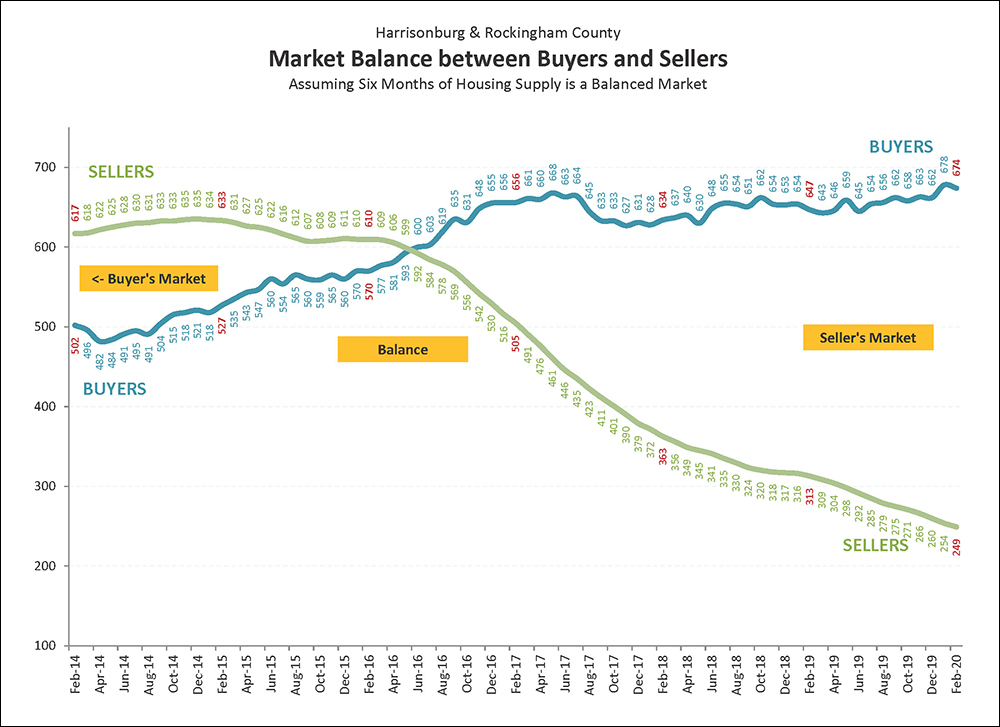
Most housing market analysts consider six months of inventory (active listings) to be an indicator of a balanced market (between buyers and sellers). The “BUYERS” trend line above is illustrating how many buyers are buying in a six month period. The “SELLERS” trend line above is illustrating how many sellers are in the market (active listings) at any given time. Over the past several years we have seen a steady increase in buyers and a declining number of sellers. In June 2016, these two trajectories crossed, and there are now many more buyers buying in a six month period than there are homes for sale -- though the buying pace has leveled off.
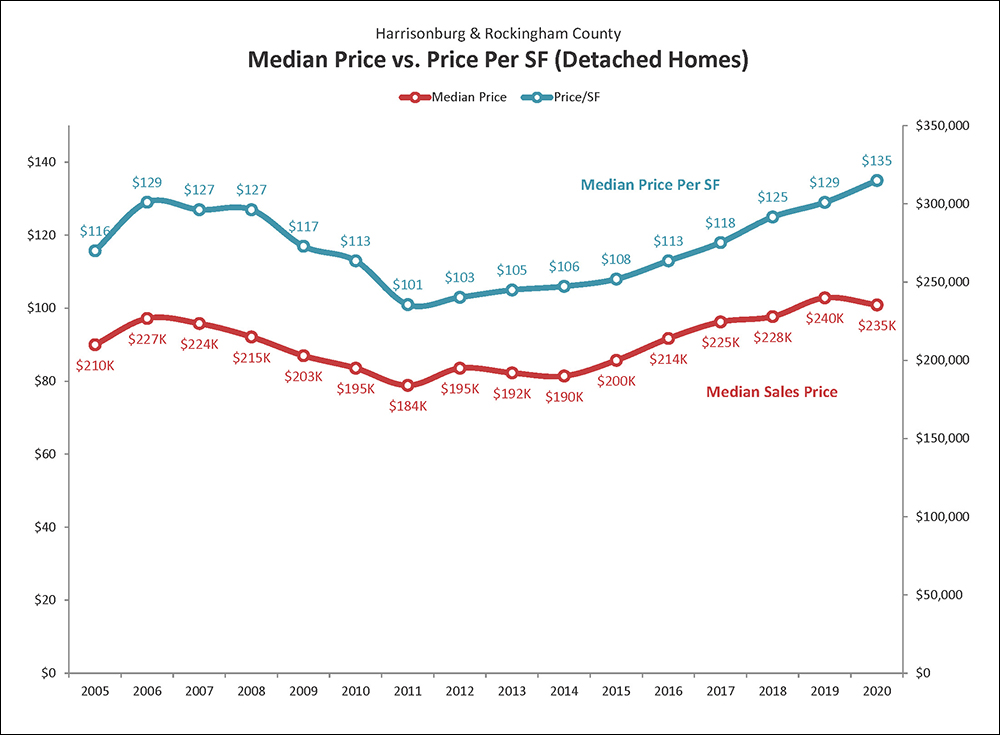
In addition to monitoring home values by overall median sales prices in our market, it can be insightful to examine the median price per square foot of homes that are selling. The graph above shows the median price per square foot of all single family homes sold over the past 15 years. The value trend captured by this graph is quite similar to the trend shown in the single family home median sales price during the same time, which validates that assumed set of changes in home values. Over the past several years (2015 through 2019) we have seen increases in the median sales price as well as the median price per square foot of single family homes.
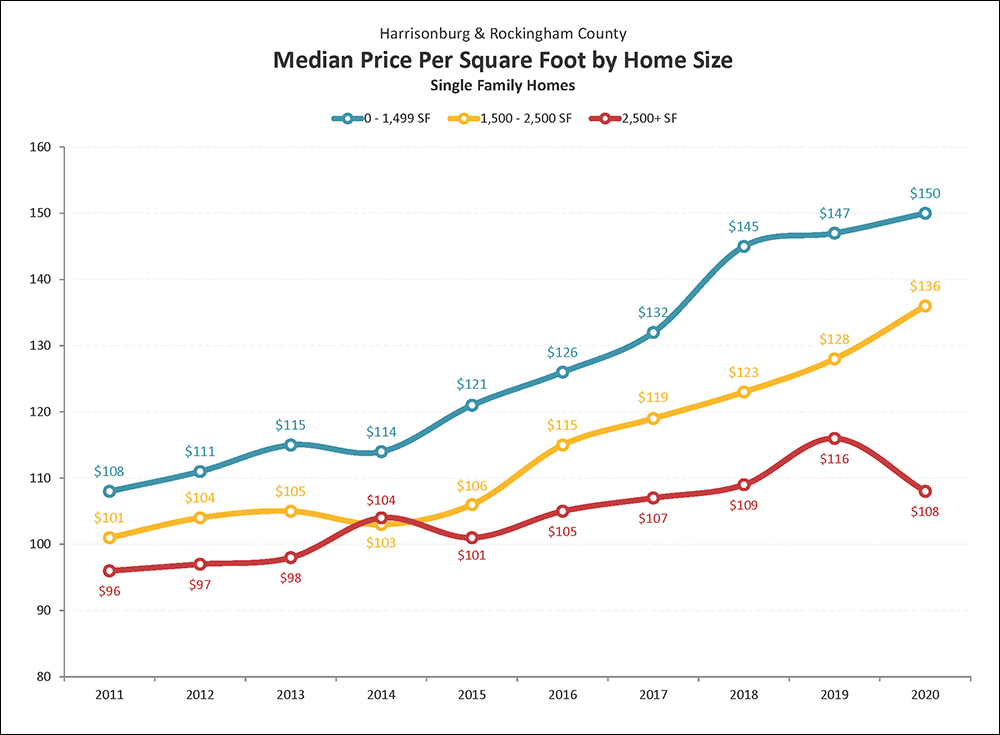
Price per square foot of single family homes certainly varies for many reasons, including the age, location, lot size and structural characteristics of each home sold. However, there are some similarities in homes of similar sizes. Looking at 2019 figures, this graph illustrates that the median price per square foot of larger homes (2500+ SF) was a good bit lower ($116/SF) than that of homes with less than 1500 SF ($147/SF) during 2019. These values cannot be used as an absolute standard against which the value of any home can be measured, but they can provide some helpful guidance when trying to determine the value of a home.
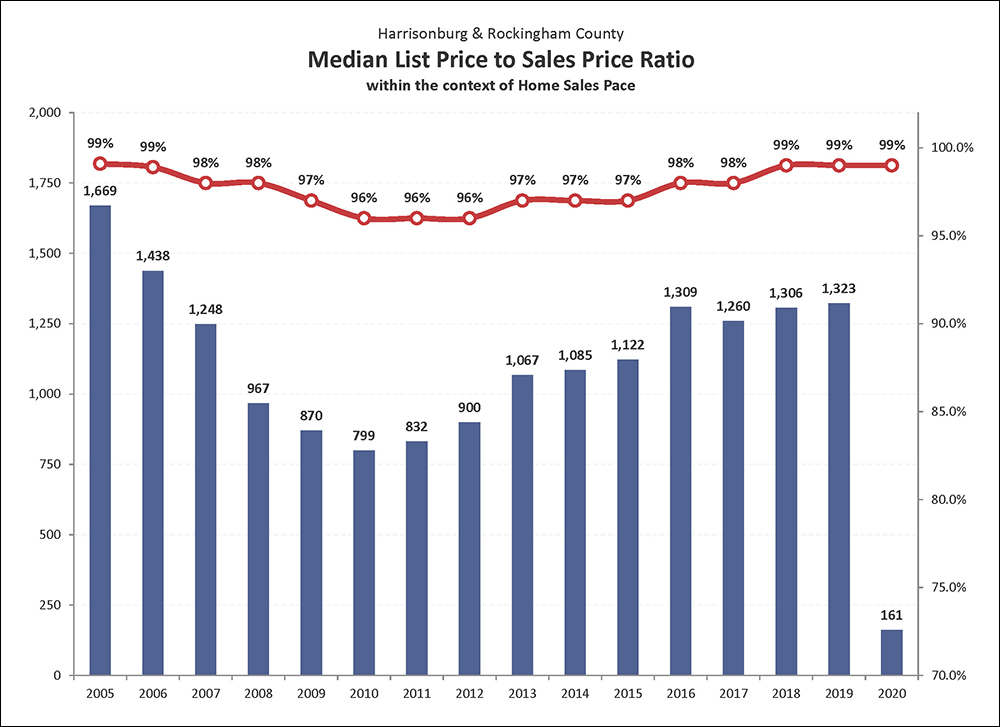
This graph shows the average list price to sales price ratio (red line) over the past 15 years as compared to the overall pace of home sales. At the peak of the housing boom (2004-2006) sellers were able to obtain a median of 99% of their asking price. Then, when the pace of home sales slowed (through 2010) this metric dropped to 96%, where it stayed for three years. Sellers started selling for slightly more in 2013-2015 when they could obtain 97% of their list price. This increased to 98% in 2016 (remained there in 2017), and has been holding at 99% since 2018. So long as we continue to see low inventory levels, this will likely stay at or around 99%.
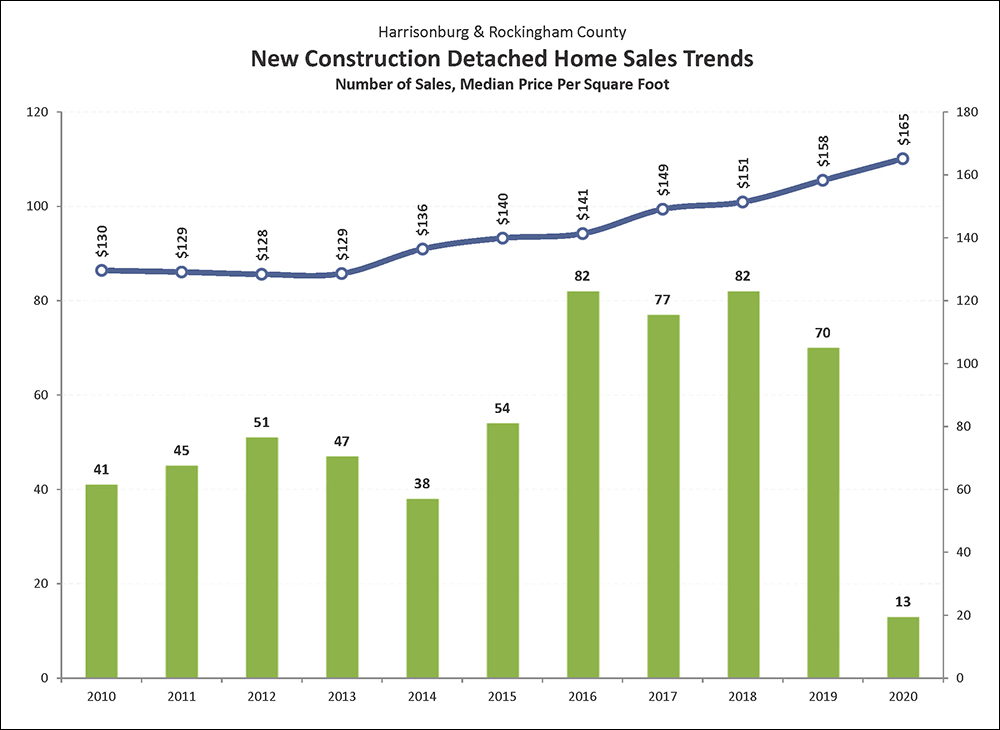
New home builders have been building more homes over the past four years (70 - 82 per year) than seen during the preceding six years. These figures, of course, only represent new homes being marketed through the MLS. Plenty of additional new homes are built by local home builders on lots already owned by the person who will live in the home - and thus they do not show up in the new home sales metrics above. When looking just at these new home sales, we see a steady increase in the price per square foot of homes being built and sold over the past ten years.
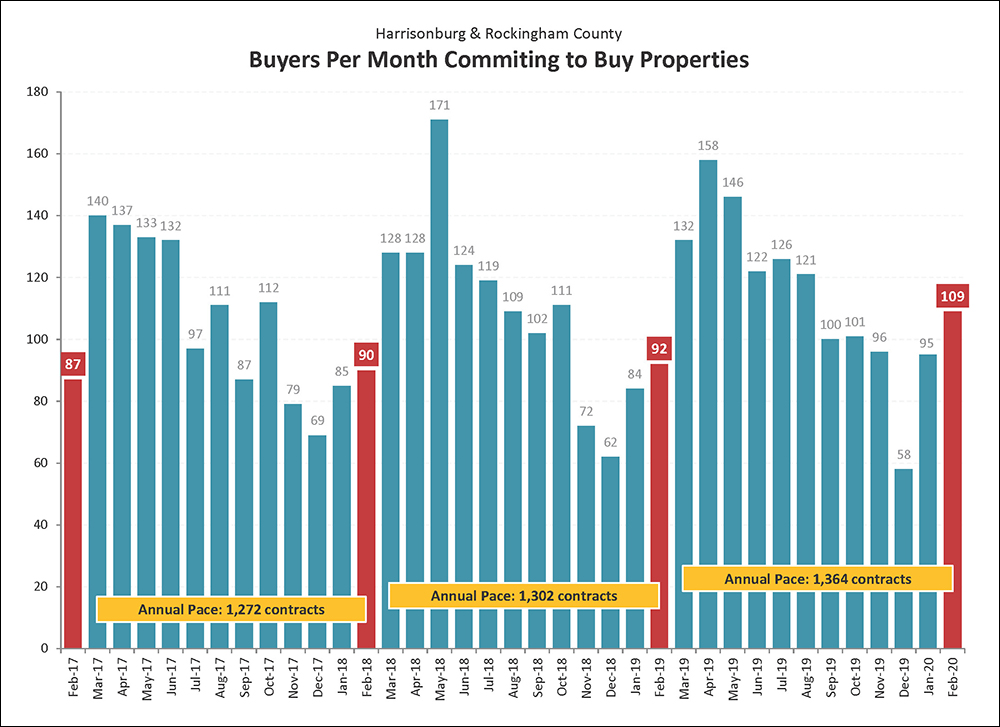
Contract activity has been quite strong in January and February of 2020 with January marking the highest month of January contracts in the past three years, and the same in February. We have typically seen around 90 contracts signed in February, and this year that number rose to 109 contracts. These past two months of strong contract activity are likely to lead to relatively strong months of closed sales in March and April. We are now on the cusp of a very busy buying season, as contract activity tends to rise quite a bit once we get into March. I expect that 130 or more contracts will be signed in March 2020.
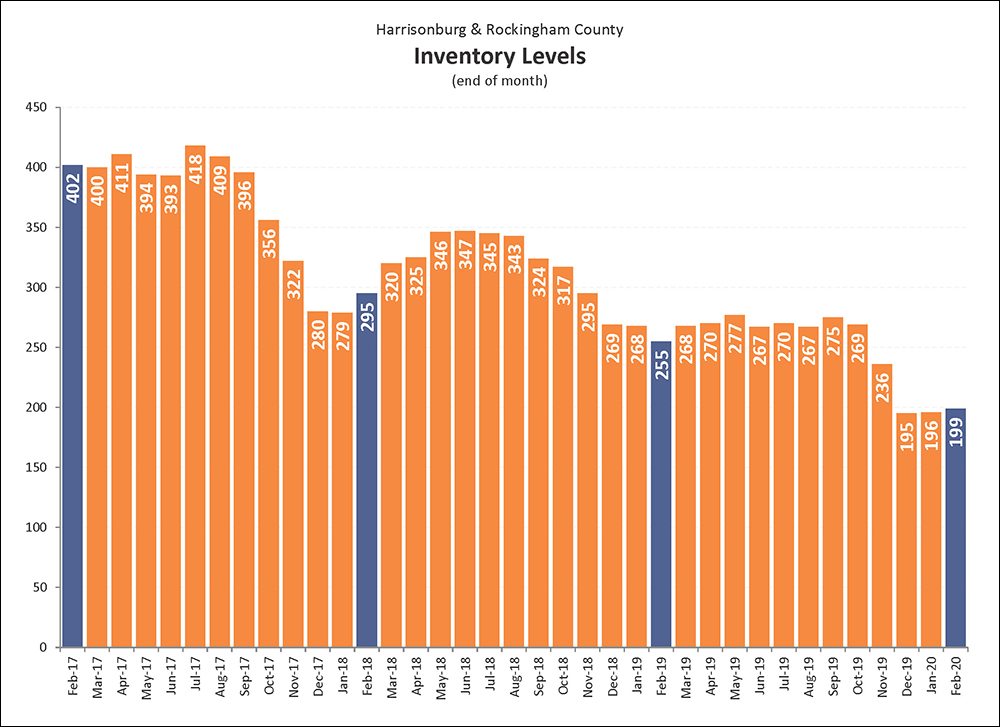
Over the past several years, inventory levels have dipped lower and lower and lower. This has not, though, been accompanied by a decline in the pace of home sales. So -- if just as many (or more) buyers are buying, how are they doing it if inventory levels are so low? They’re doing it with speed. The pace of home sales can increase, with inventory levels declining if the median “days on market” is also declining, which is definitely the case in our local market. So, plenty (maybe, maybe not) homes are being listed for sale, but they are then going under contract quickly, which keeps inventory levels low but the pace of home sales high.
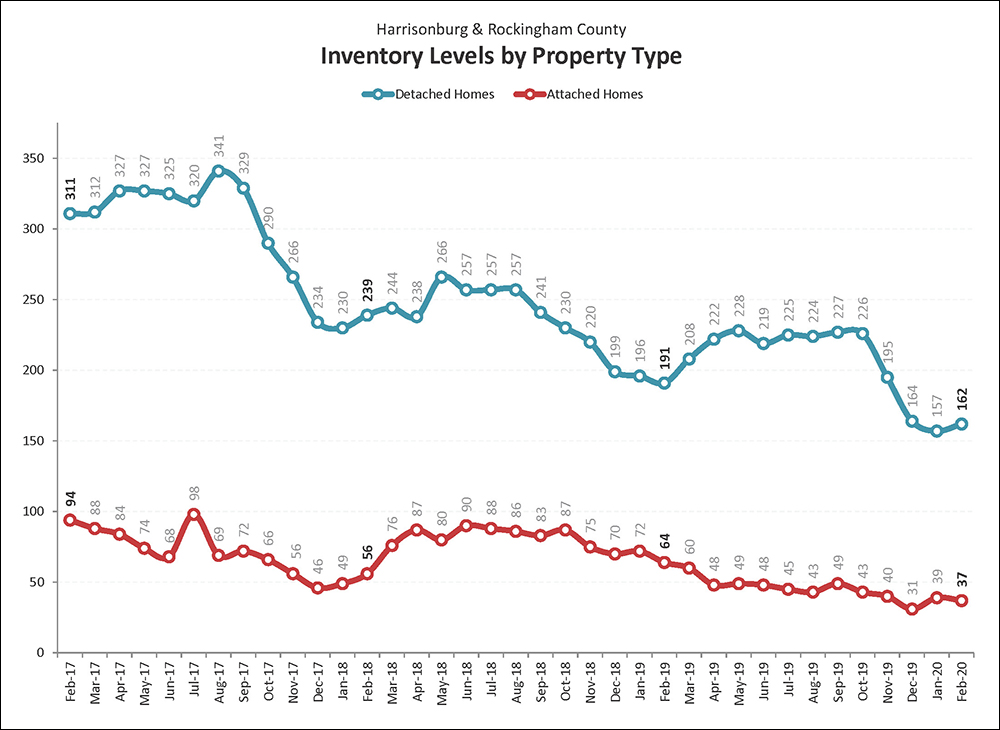
This graph examines the differences in inventory levels over time when examining only single family homes as compared to attached dwellings (townhouses, duplexes, condos). The number of detached homes for sale has decreased by 15% over the past year, while the number of attached homes (townhouses, duplexes and condos) for sale has decreased by 42% over the past year. I am hopeful that we’ll start to see inventory levels rise as we get into March and April this year -- but if buyers keep snapping up the new listings as fast as they come on the market, inventory levels are likely to remain low.
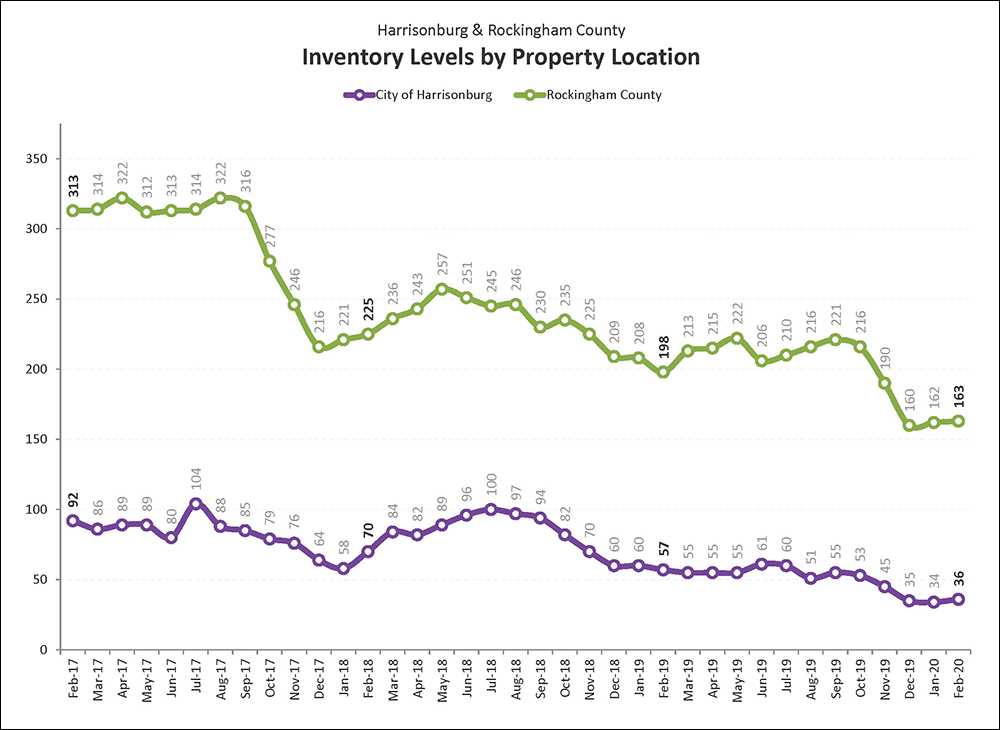
Inventory levels have fallen 18% in Rockingham County over the past year and have fallen an even more drastic 37% in the City of Harrisonburg during the same timeframe. Of note -- while there are approximately twice as many home sales in the County than in the City -- there are more than four times as many homes for sale in the County than in the City. As such, the low inventory levels are much more of an issue in the City right now if we look at both sellers (supply) and buyers (demand). This is likely leading to the faster increases in median sales price in the City, and the lower median days on market in the City.
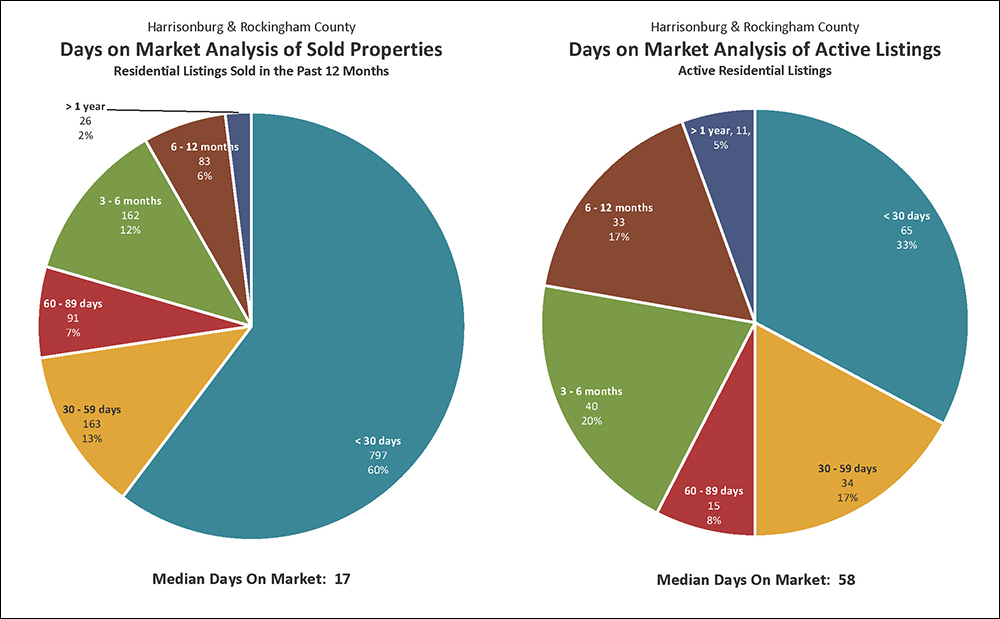
Declining inventory levels are contributing to an overall decline in the time it takes to sell a home in Harrisonburg and Rockingham County. The current median “Days on Market” is 17 days for homes that have sold in the past year. Remarkably, 60% of homes that have sold in the past year have gone under contract within 30 days of having hit the market. Combine that with those that went under contract during the second month on the market, and you’ll find that 73% of homes that sell go under contract within 60 days. The graph to the right, above, shows the length of time that each active listing has been on the market for sale.
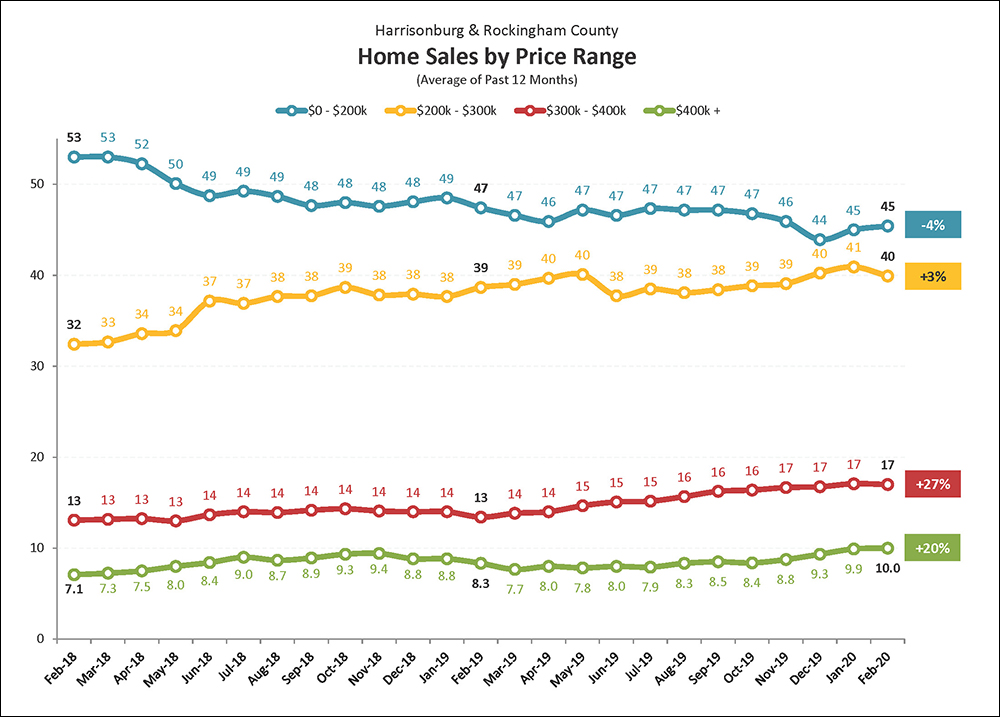
The pace of home sales in Harrisonburg and Rockingham County varies significantly based on price range. The graph above shows the average number of home sales per month (given a 12-month average) as we have passed through the past two years. Home sales have been declining over the past several years in the “under $200K” category -- though likely because of limited inventory, and fewer properties existing in this range based on increasing home values. We have seen year-over-year increases in all three of the other price ranges ($200K-$300K, $300K-$400K, $400K+) over the past year.
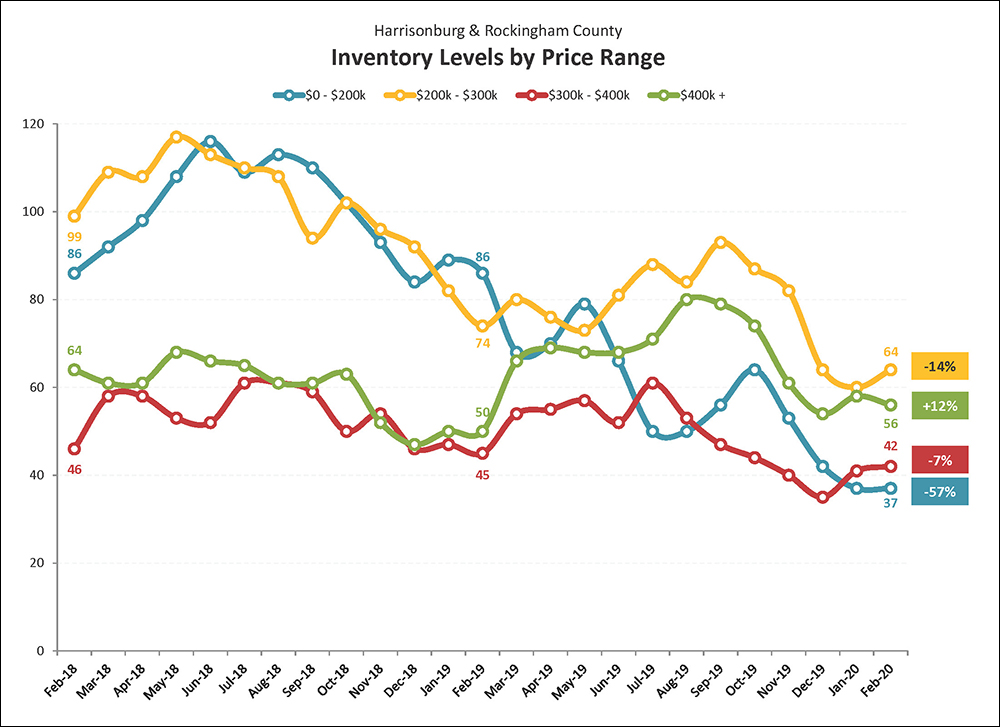
Inventory levels shift up and down seasonally, but we are also seeing differences in year-over-year trajectories in each of the four price ranges outlined above. Inventory levels of homes under $200K have fallen dramatically (-57%) over the past year, while the declines in inventory in the $200K - 300K price range (-14%) and $300K - $400K price range (-7%) are quite a bit more mild. The only price range in which we have seen a year over year increase in inventory levels is the $400K+ price range where inventory levels have increased 12% over the past year.
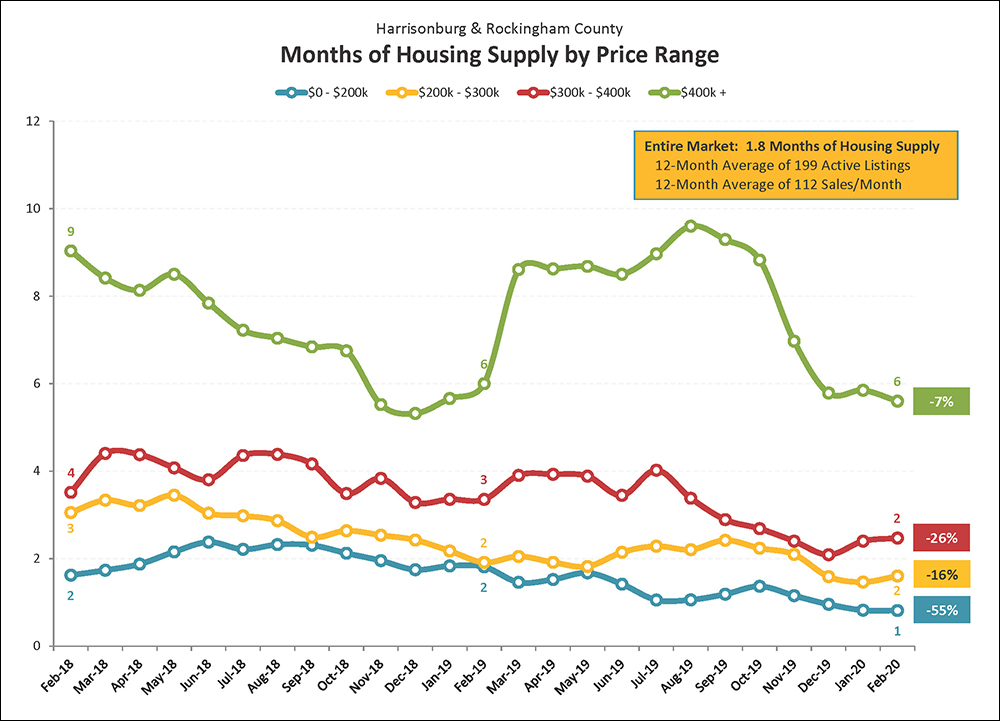
With so many home sales (lots of buyers) and so few homes on the market (not so many sellers), there are low levels of supply in some price ranges in our local real estate market. The graph above illustrates that while it would take six months to sell all of the homes currently for sale over $400K if the same number of buyers bought each month as have been buying (on average) over the past 12 months and if no new listings came on the market -- but it would only take one month (!!) to burn through the under $200K inventory. Many consider a six month supply to be a balance between buyers and sellers.
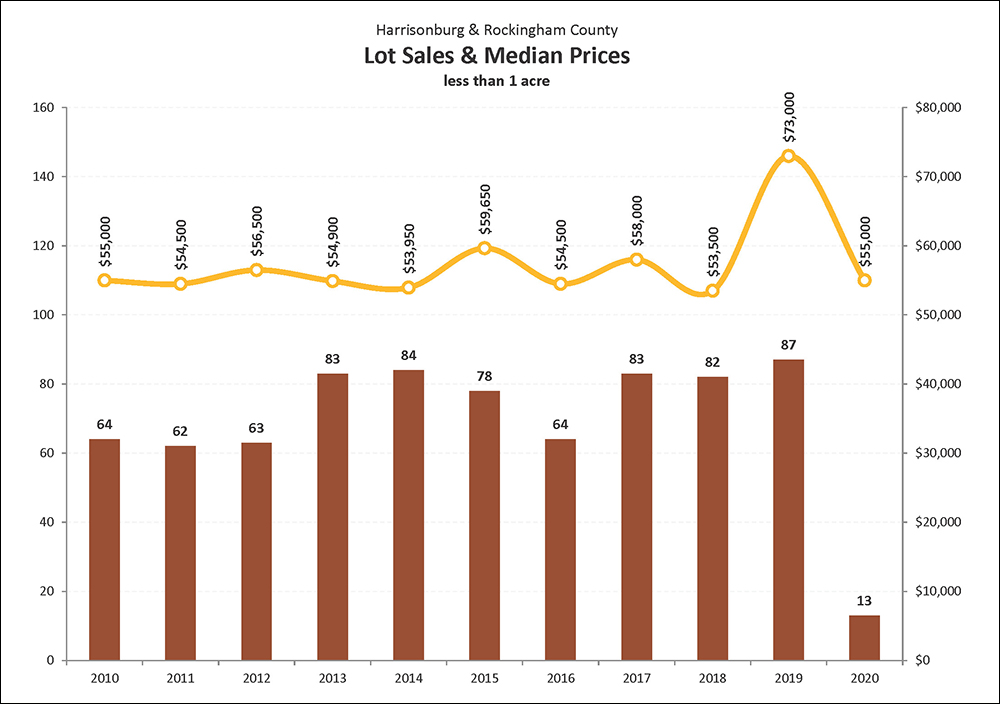
With the exception of 2016, we have seen between 78 and 90 lot sales of less than an acre for each of the past seven years. This is a sharp decline from the 260 - 400 lot sales seen in 2002-2005, but it is an improvement over where things were (58-64 sales) between 2009 and 2012. From a value perspective, the sales prices of these “less than an acre” lots have also been rather stable between 2008 and 2018 -- fluctuating no further than between $53K and $60K -- but then increased to $73K in 2019. This rise to $73K seems dramatic until you look further back to the meteoric rise and then fall to/from $100K back in 2006.
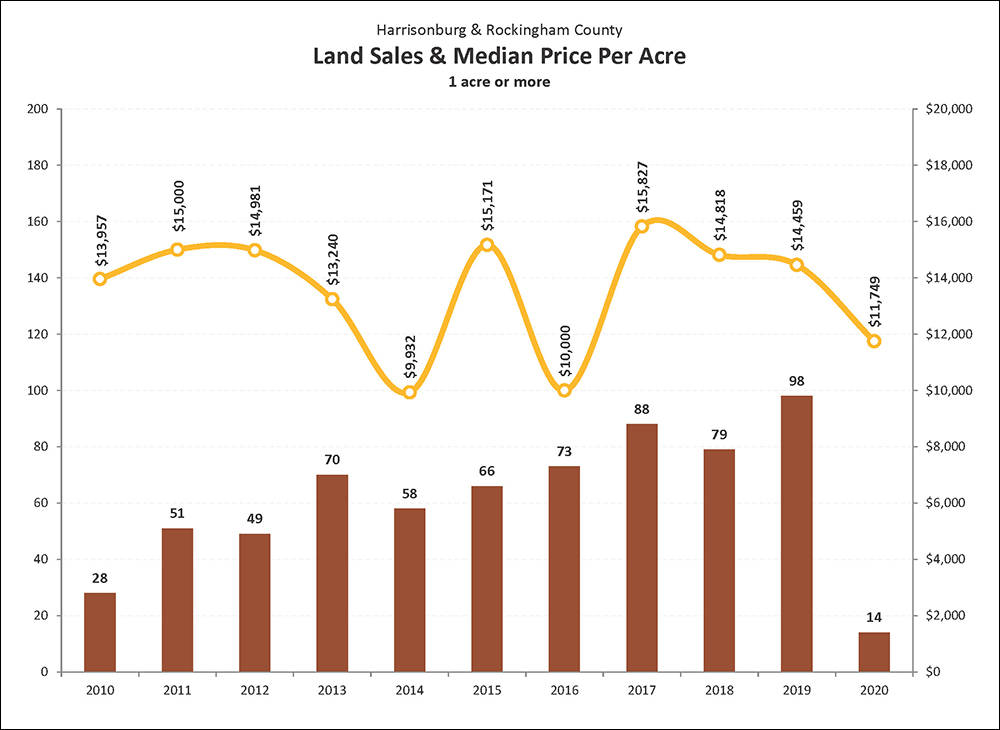
The pace of sales of parcels of land larger than one acre in Harrisonburg or Rockingham County increased over the past nine years to 98 land sales -- marking the highest year of sales since 2005. The median price per acre declined in 2018 to $14,818 and again (slightly) in 2019 to $14,459. Of note -- some aspects of this “median price per acre” calculation are affected by which parcels actually sell in a given year. The increase in buyer demand over the past nine years has not seemed to have created any upward lifting pressure on values to date.
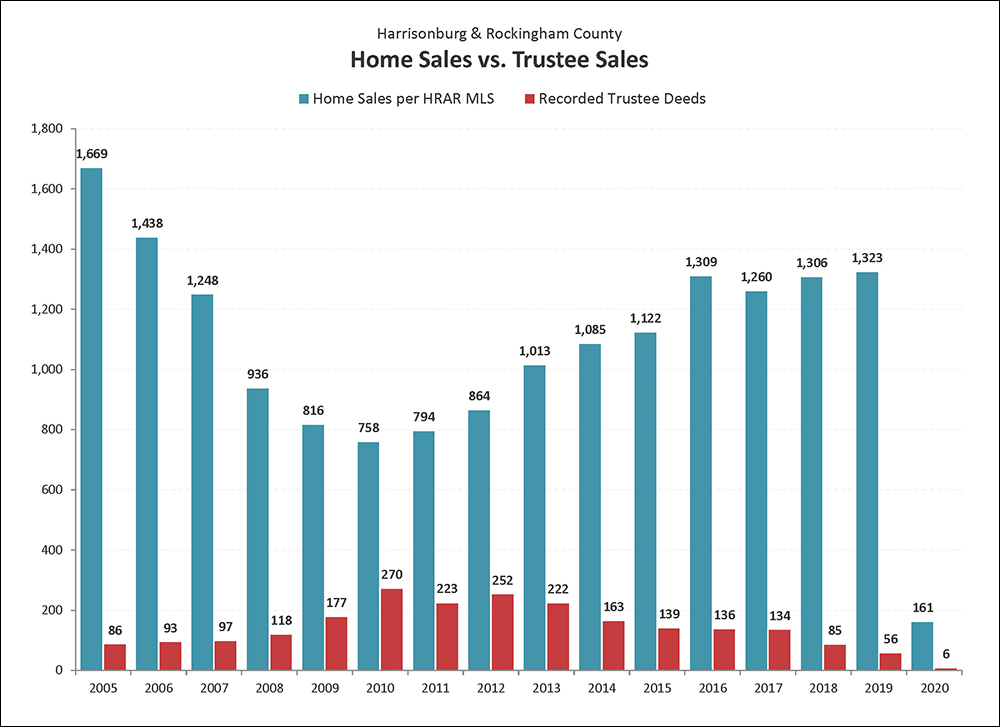
The graph above is a comparison of two imprecise measures -- but the comparison can still be helpful. The blue bars show the number of home sales recorded in the HRAR MLS -- this does not include private sales that did not involve a Realtor, nor new home sales directly from a builder. The red bars show the number of recorded Trustee Deeds. Some foreclosed properties then show up again as REO properties. The foreclosure rate in our local market area has been trending downward over the past nine years and is now at the lowest level seen anytime in the past 15 years!
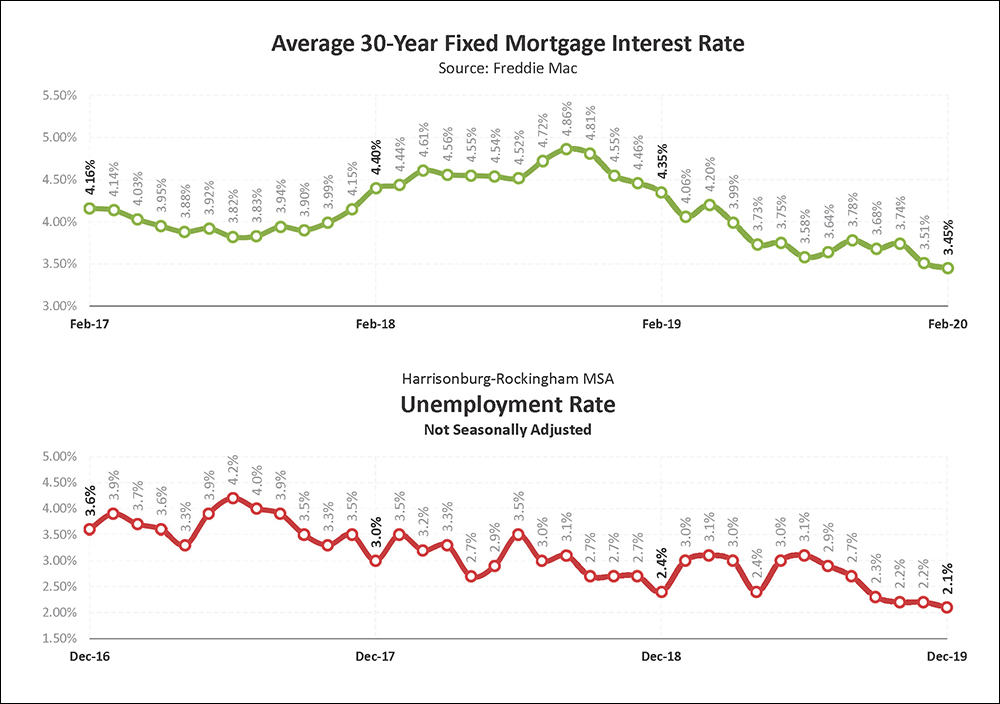
As shown in the top graph above, for most of the past three years, home buyers have seen tremendously low interest rates -- almost always under 4% except in late 2016 and during just about all of 2018. Encouragingly, the average mortgage interest rate has (mostly) decline over the past year and is now below hovering just below 3.5%. The second graph above illustrates trends in the local unemployment rate -- which has shown a general downward trend over the past several years to a current level of 2.1%. A low local unemployment rate and low mortgage interest rates help our local housing market remain stable.