
A service of Scott P. Rogers, Associate Broker, Funkhouser Real Estate Group 540.578.0102 | scott@HarrisonburgHousingToday.com
January 2022 Harrisonburg & Rockingham County Real Estate Market Report
January 14, 2022
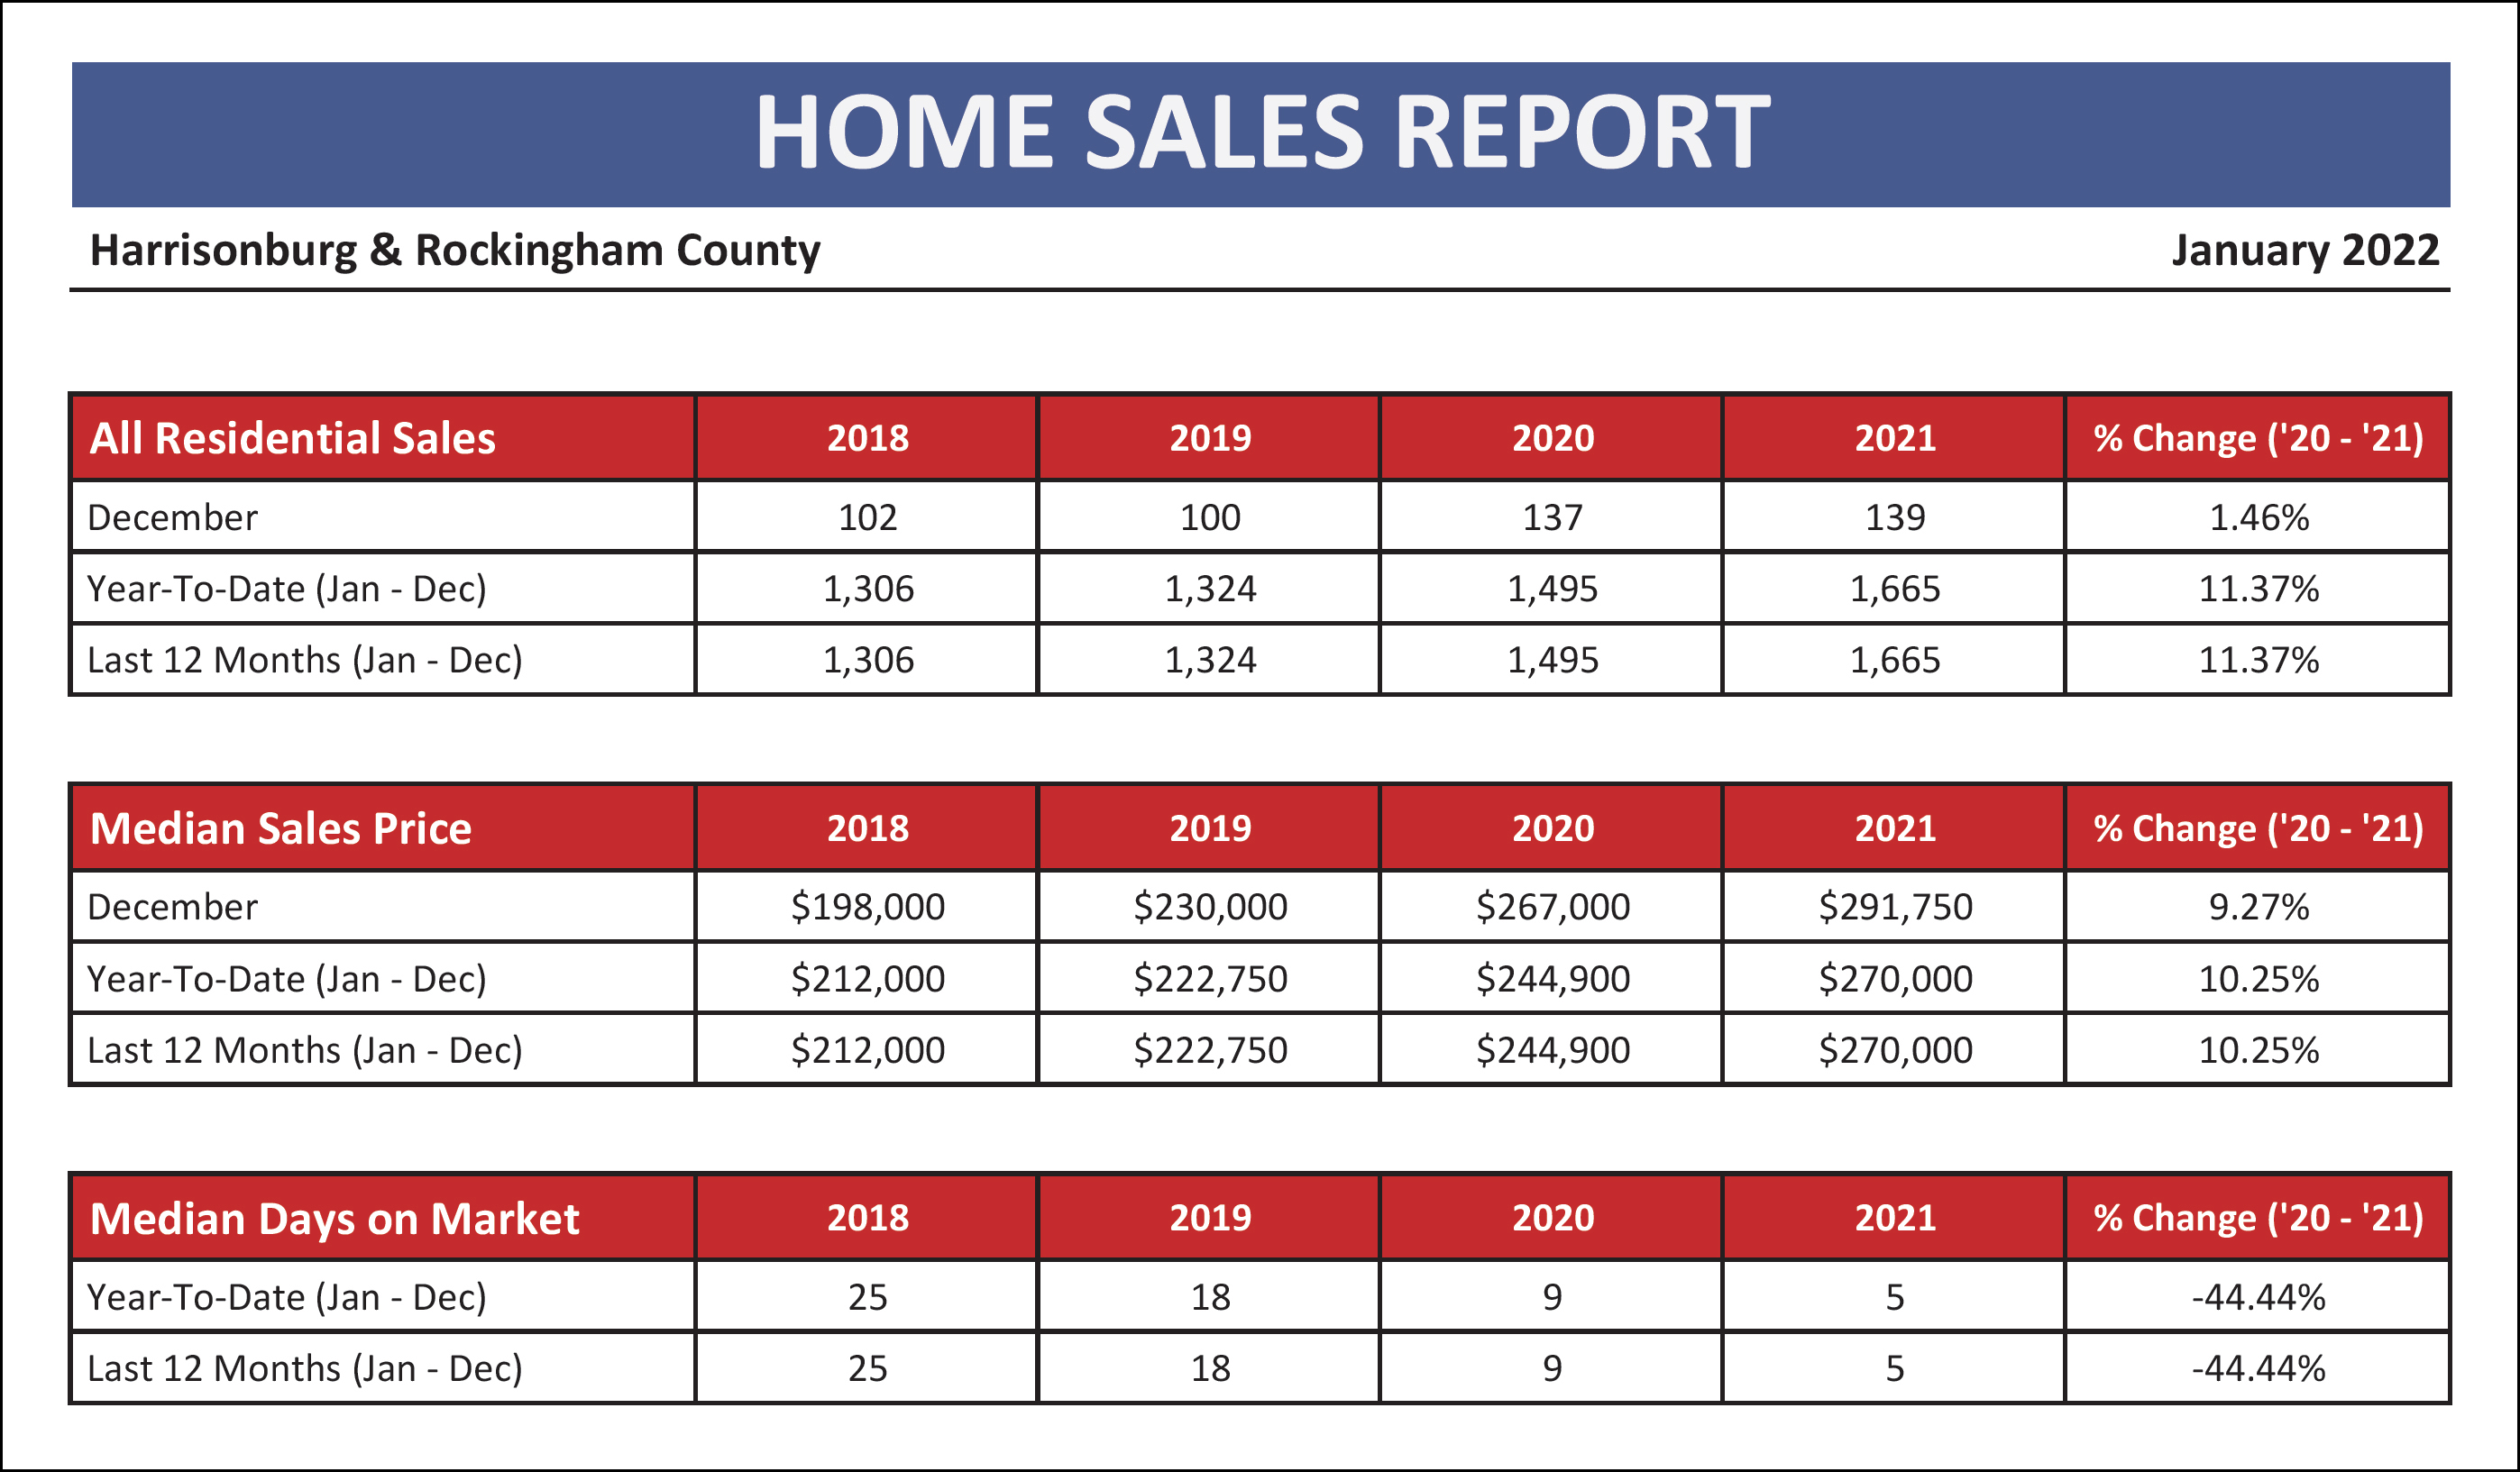
Home sales in Harrisonburg and Rockingham County finished out strong in December with ever so slightly more home sales this December (139) than in the previous December (137) which contributed to an overall 11% increase in the pace of home sales during 2021! In addition to seeing more home sales in 2021, we also saw the median sales price increase significantly in 2021 - rising from $244,900 one year ago at the end of 2020 to $270,000 at the end of 2021. Finally, homes sold faster in 2021 than in 2020 with the median days on market declining from nine days in 2020 to only five days in 2021!
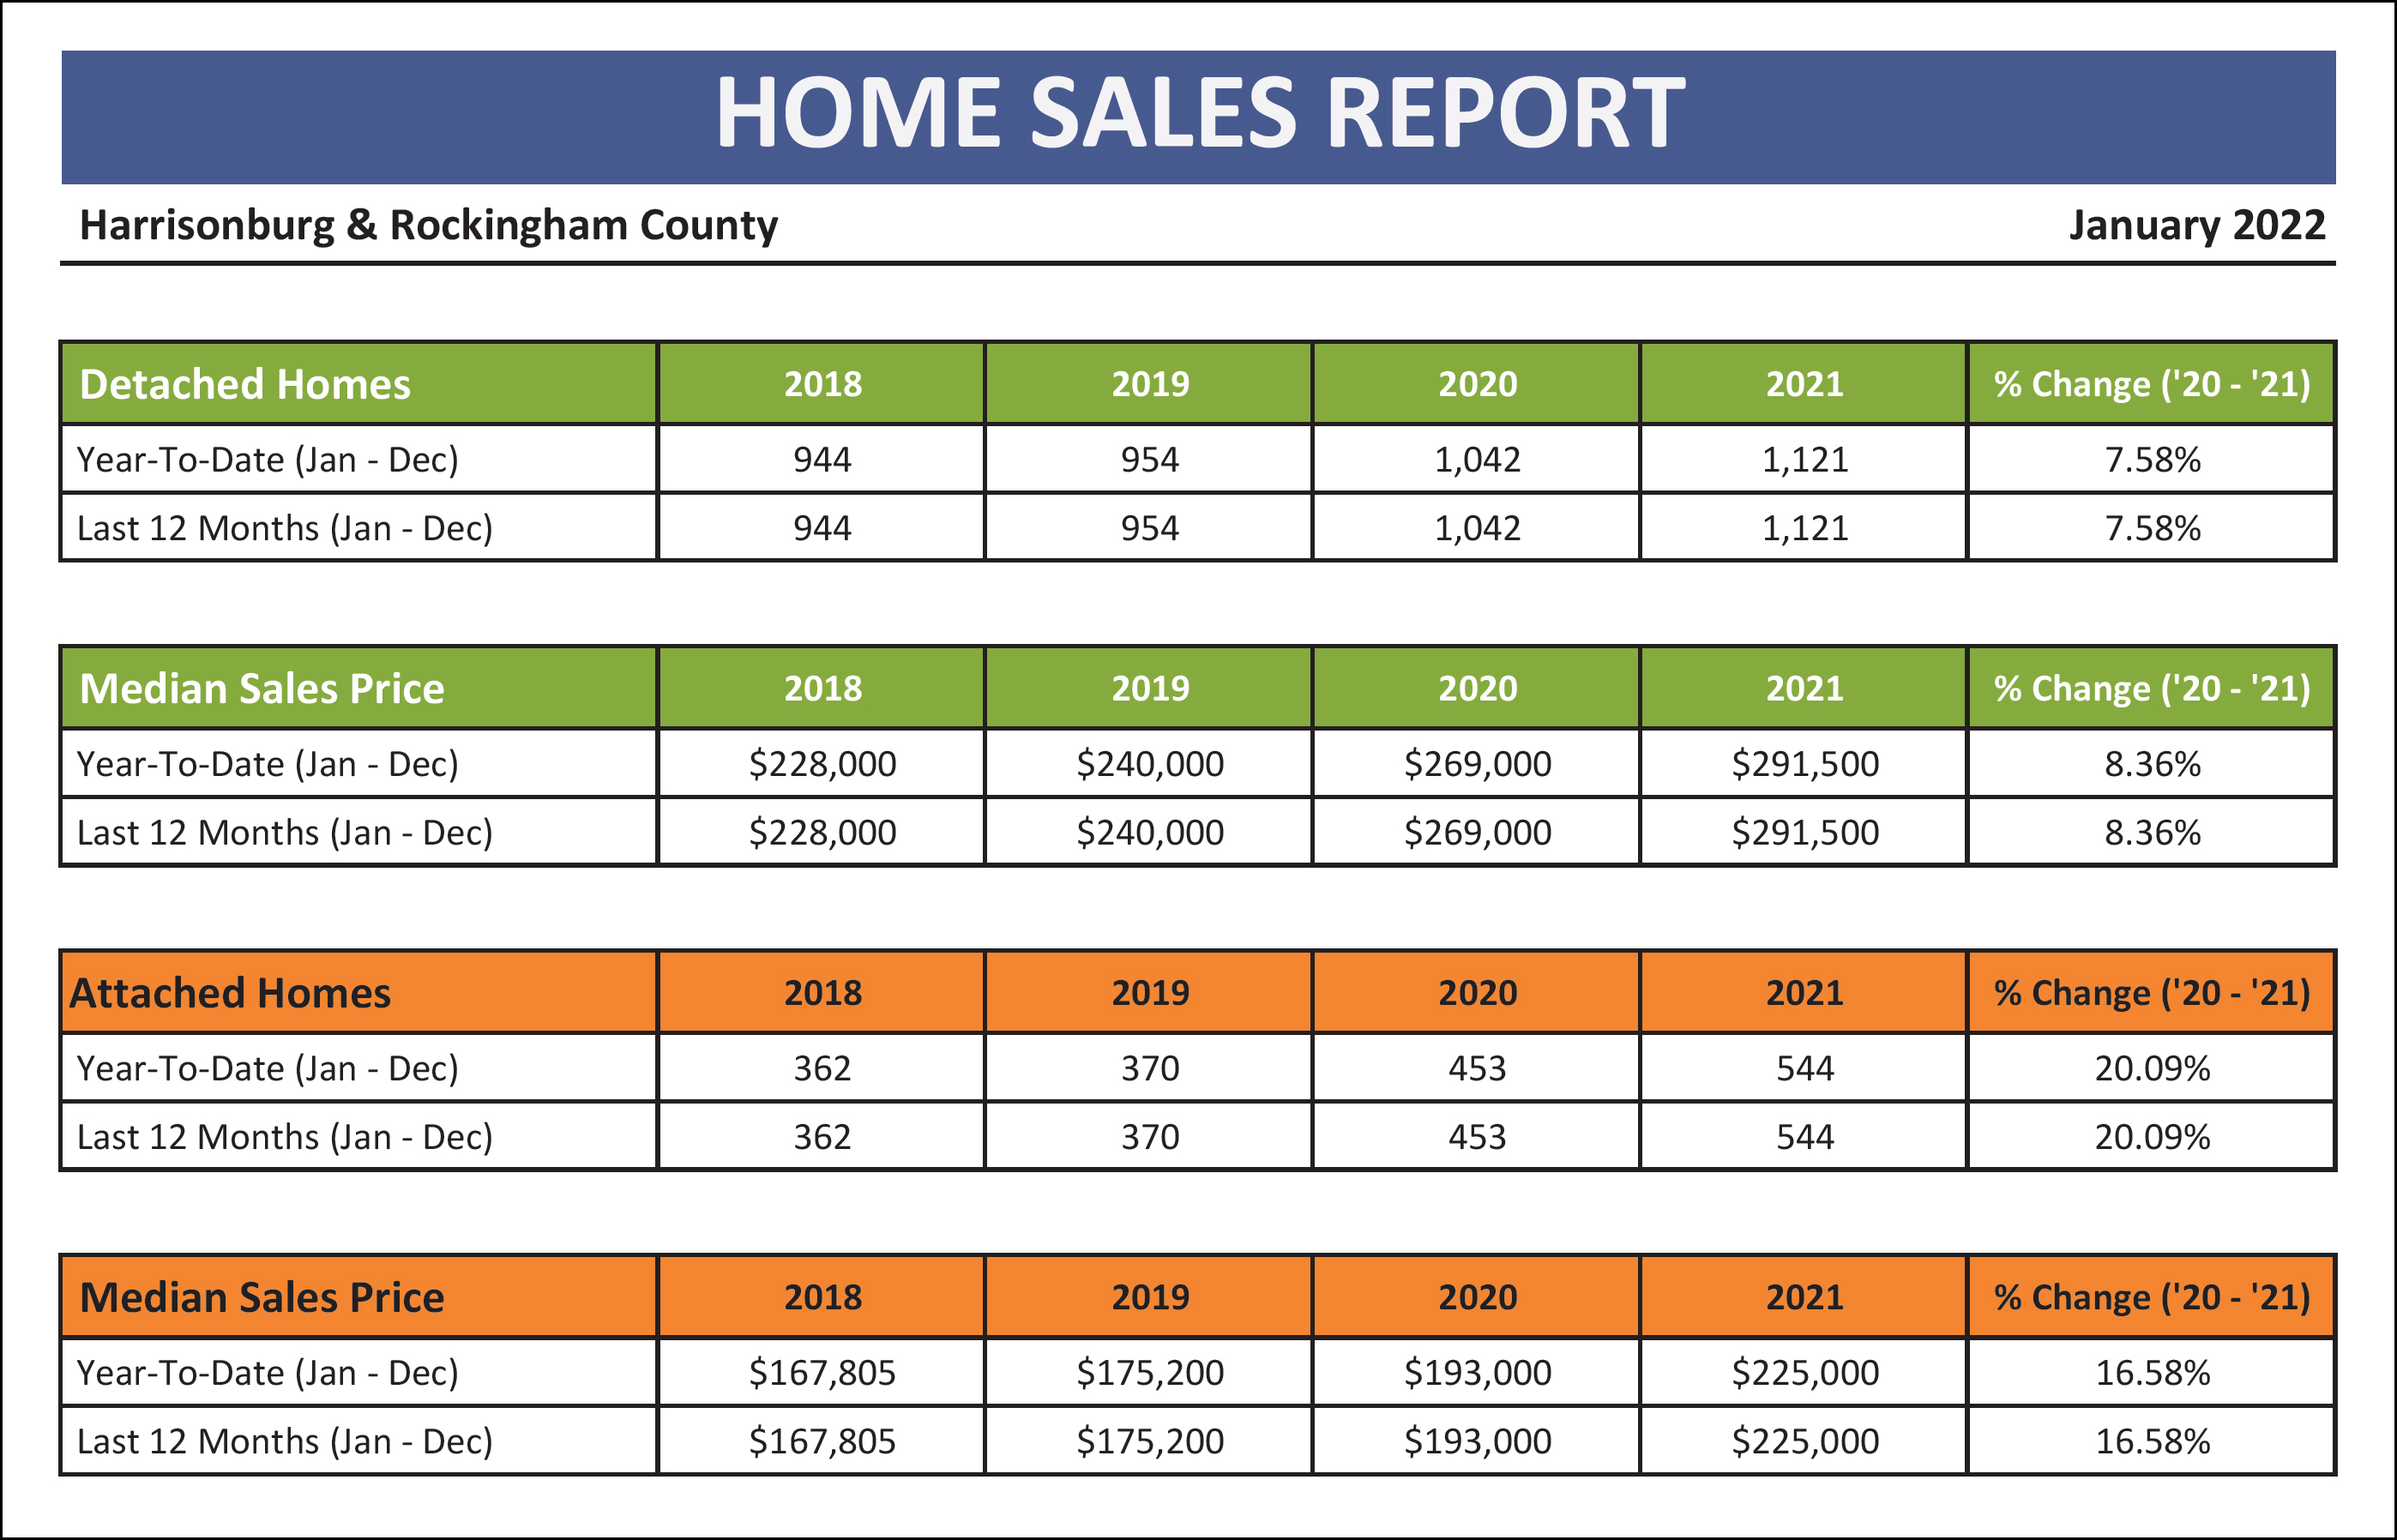
The green charts above shows trends in detached home sales -- as compared to the orange charts which show attached home sales, comprised of duplexes, townhouses and condominiums. Over the past 12 months we have seen an 8% increase in the pace of detached home sales, and an 8% increase in their median sales price. In contrast, there has been a much larger (20%) increase in the pace of attached home sales, and also a larger (17%) increase in the median sales price of those attached homes. The median sales price of detached homes is now up to $291,500 -- an increase of more than $20,000 over the past year.
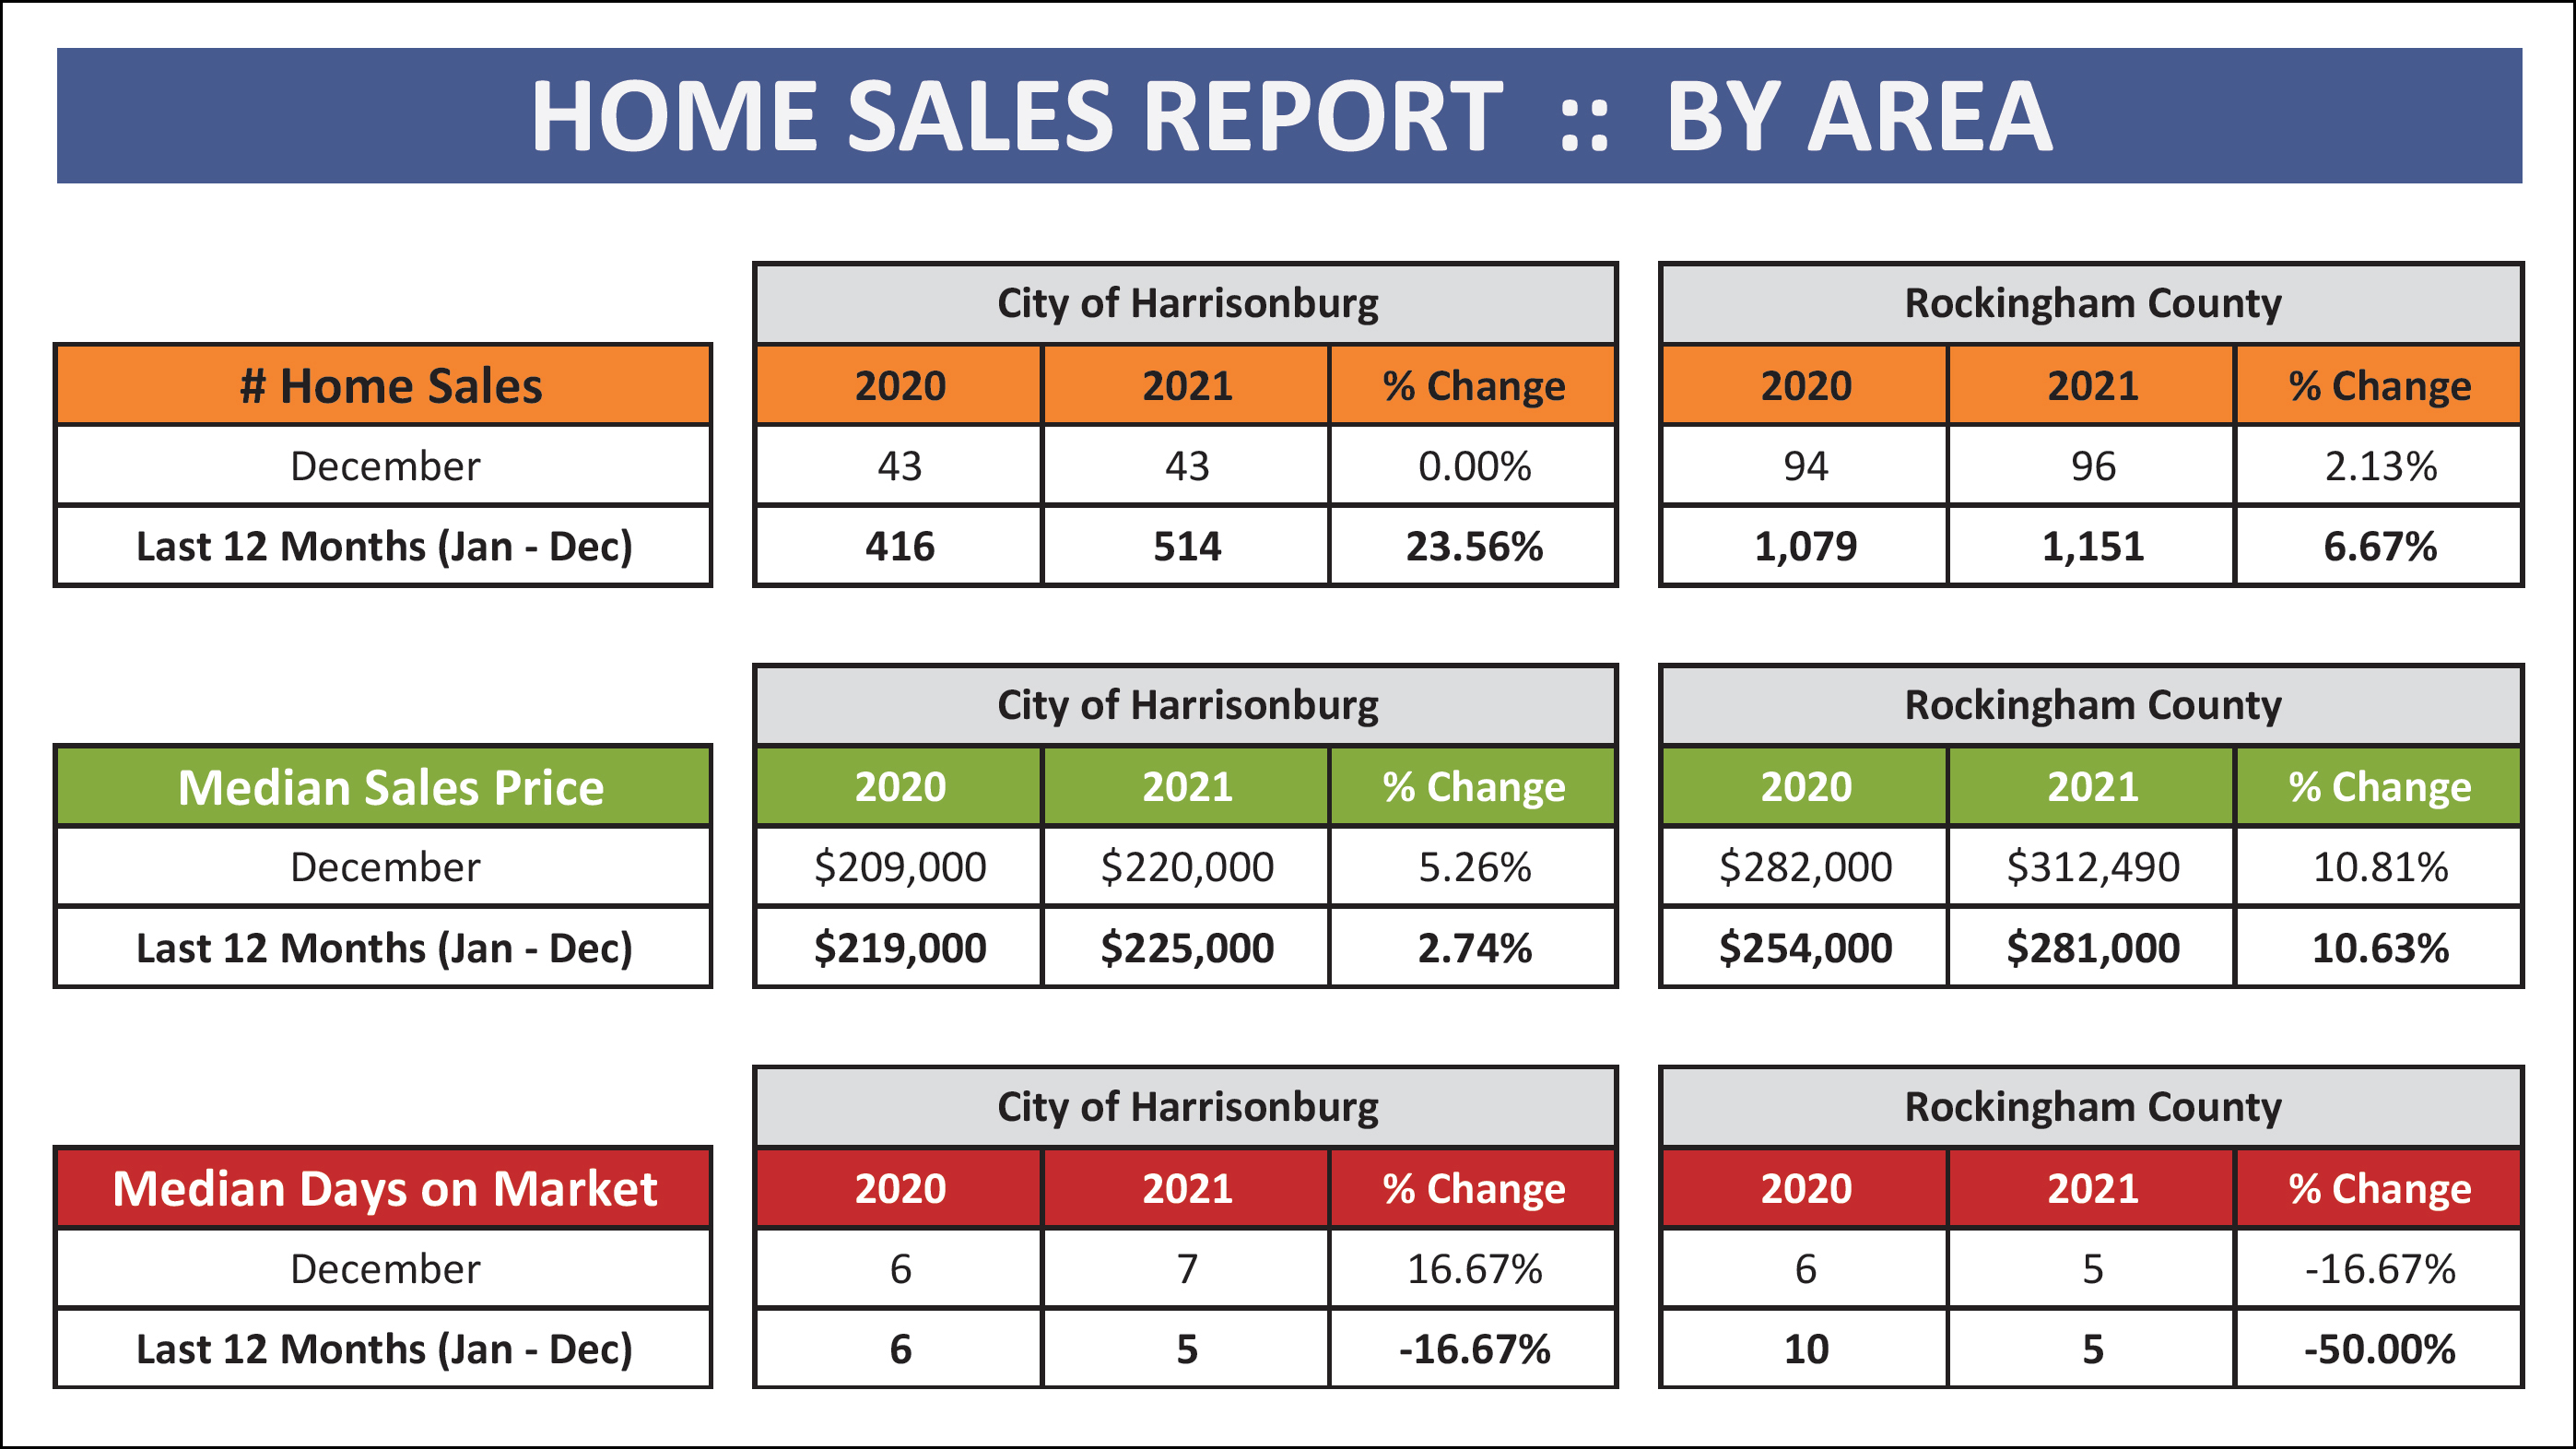
More than twice as many homes sell each year in Rockingham County as compared to the City of Harrisonburg. Over the past year we have seen a significant increase in City home sales -- with 24% more sales -- as well as a 3% increase in the median sales price of those homes. Meanwhile, in the County, the lower, 7% increase in home sales over the past year, was accompanied by a larger 11% increase in the median sales price in the County. The median sales price in the County is a good bit higher ($281,000) than the City ($225,000) though likely because more townhomes, duplexes and condos are located in the City.
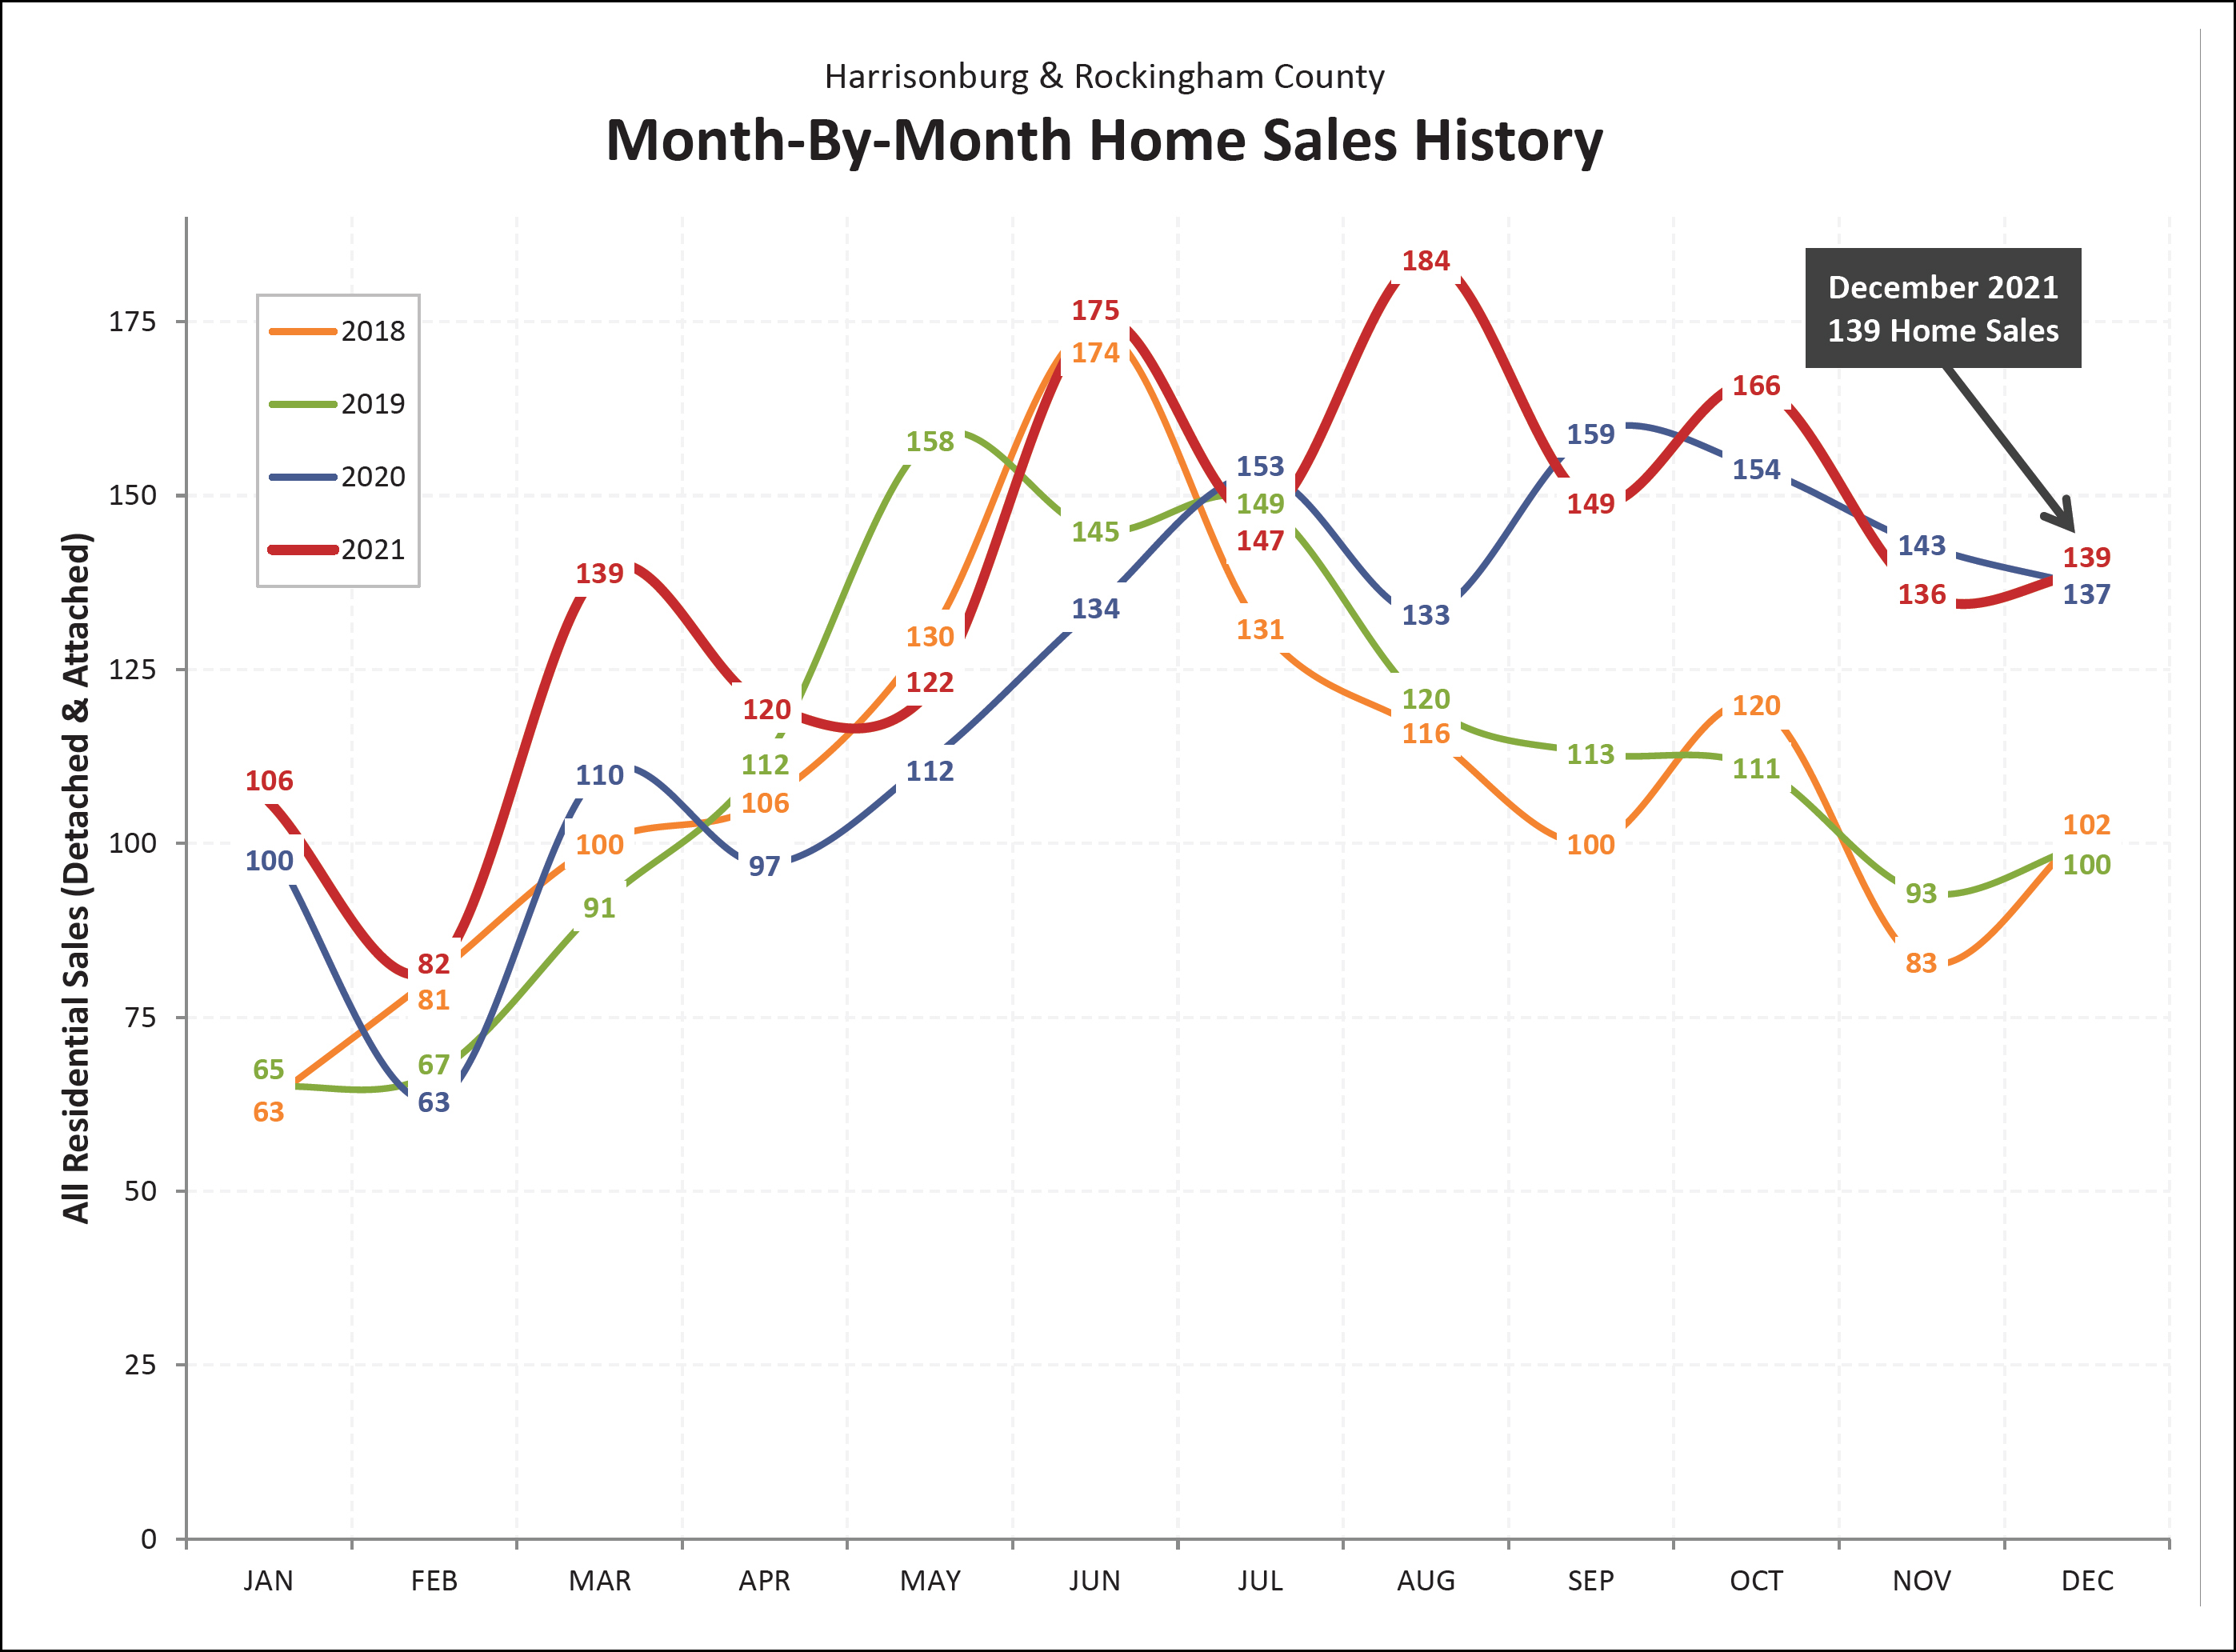
All the way through to the end, 2021 was a year of fits and starts with the pace of monthly home sales in Harrisonburg and Rockingham County. We’d see sales dip one month, followed by a sharp increase the following month. We saw record new highs in March (139 compared to 110 previously) and July (184 compared to 133 previously) and all in all a strong, if irregular and unpredictable year of home sales. The last quarter of 2020 was, it seemed, abnormally strong because of Covid pushing some home sales further back into the year. But as we close out 2021 we see that the tail end of 2021 was able to be just as strong as in the previous year!
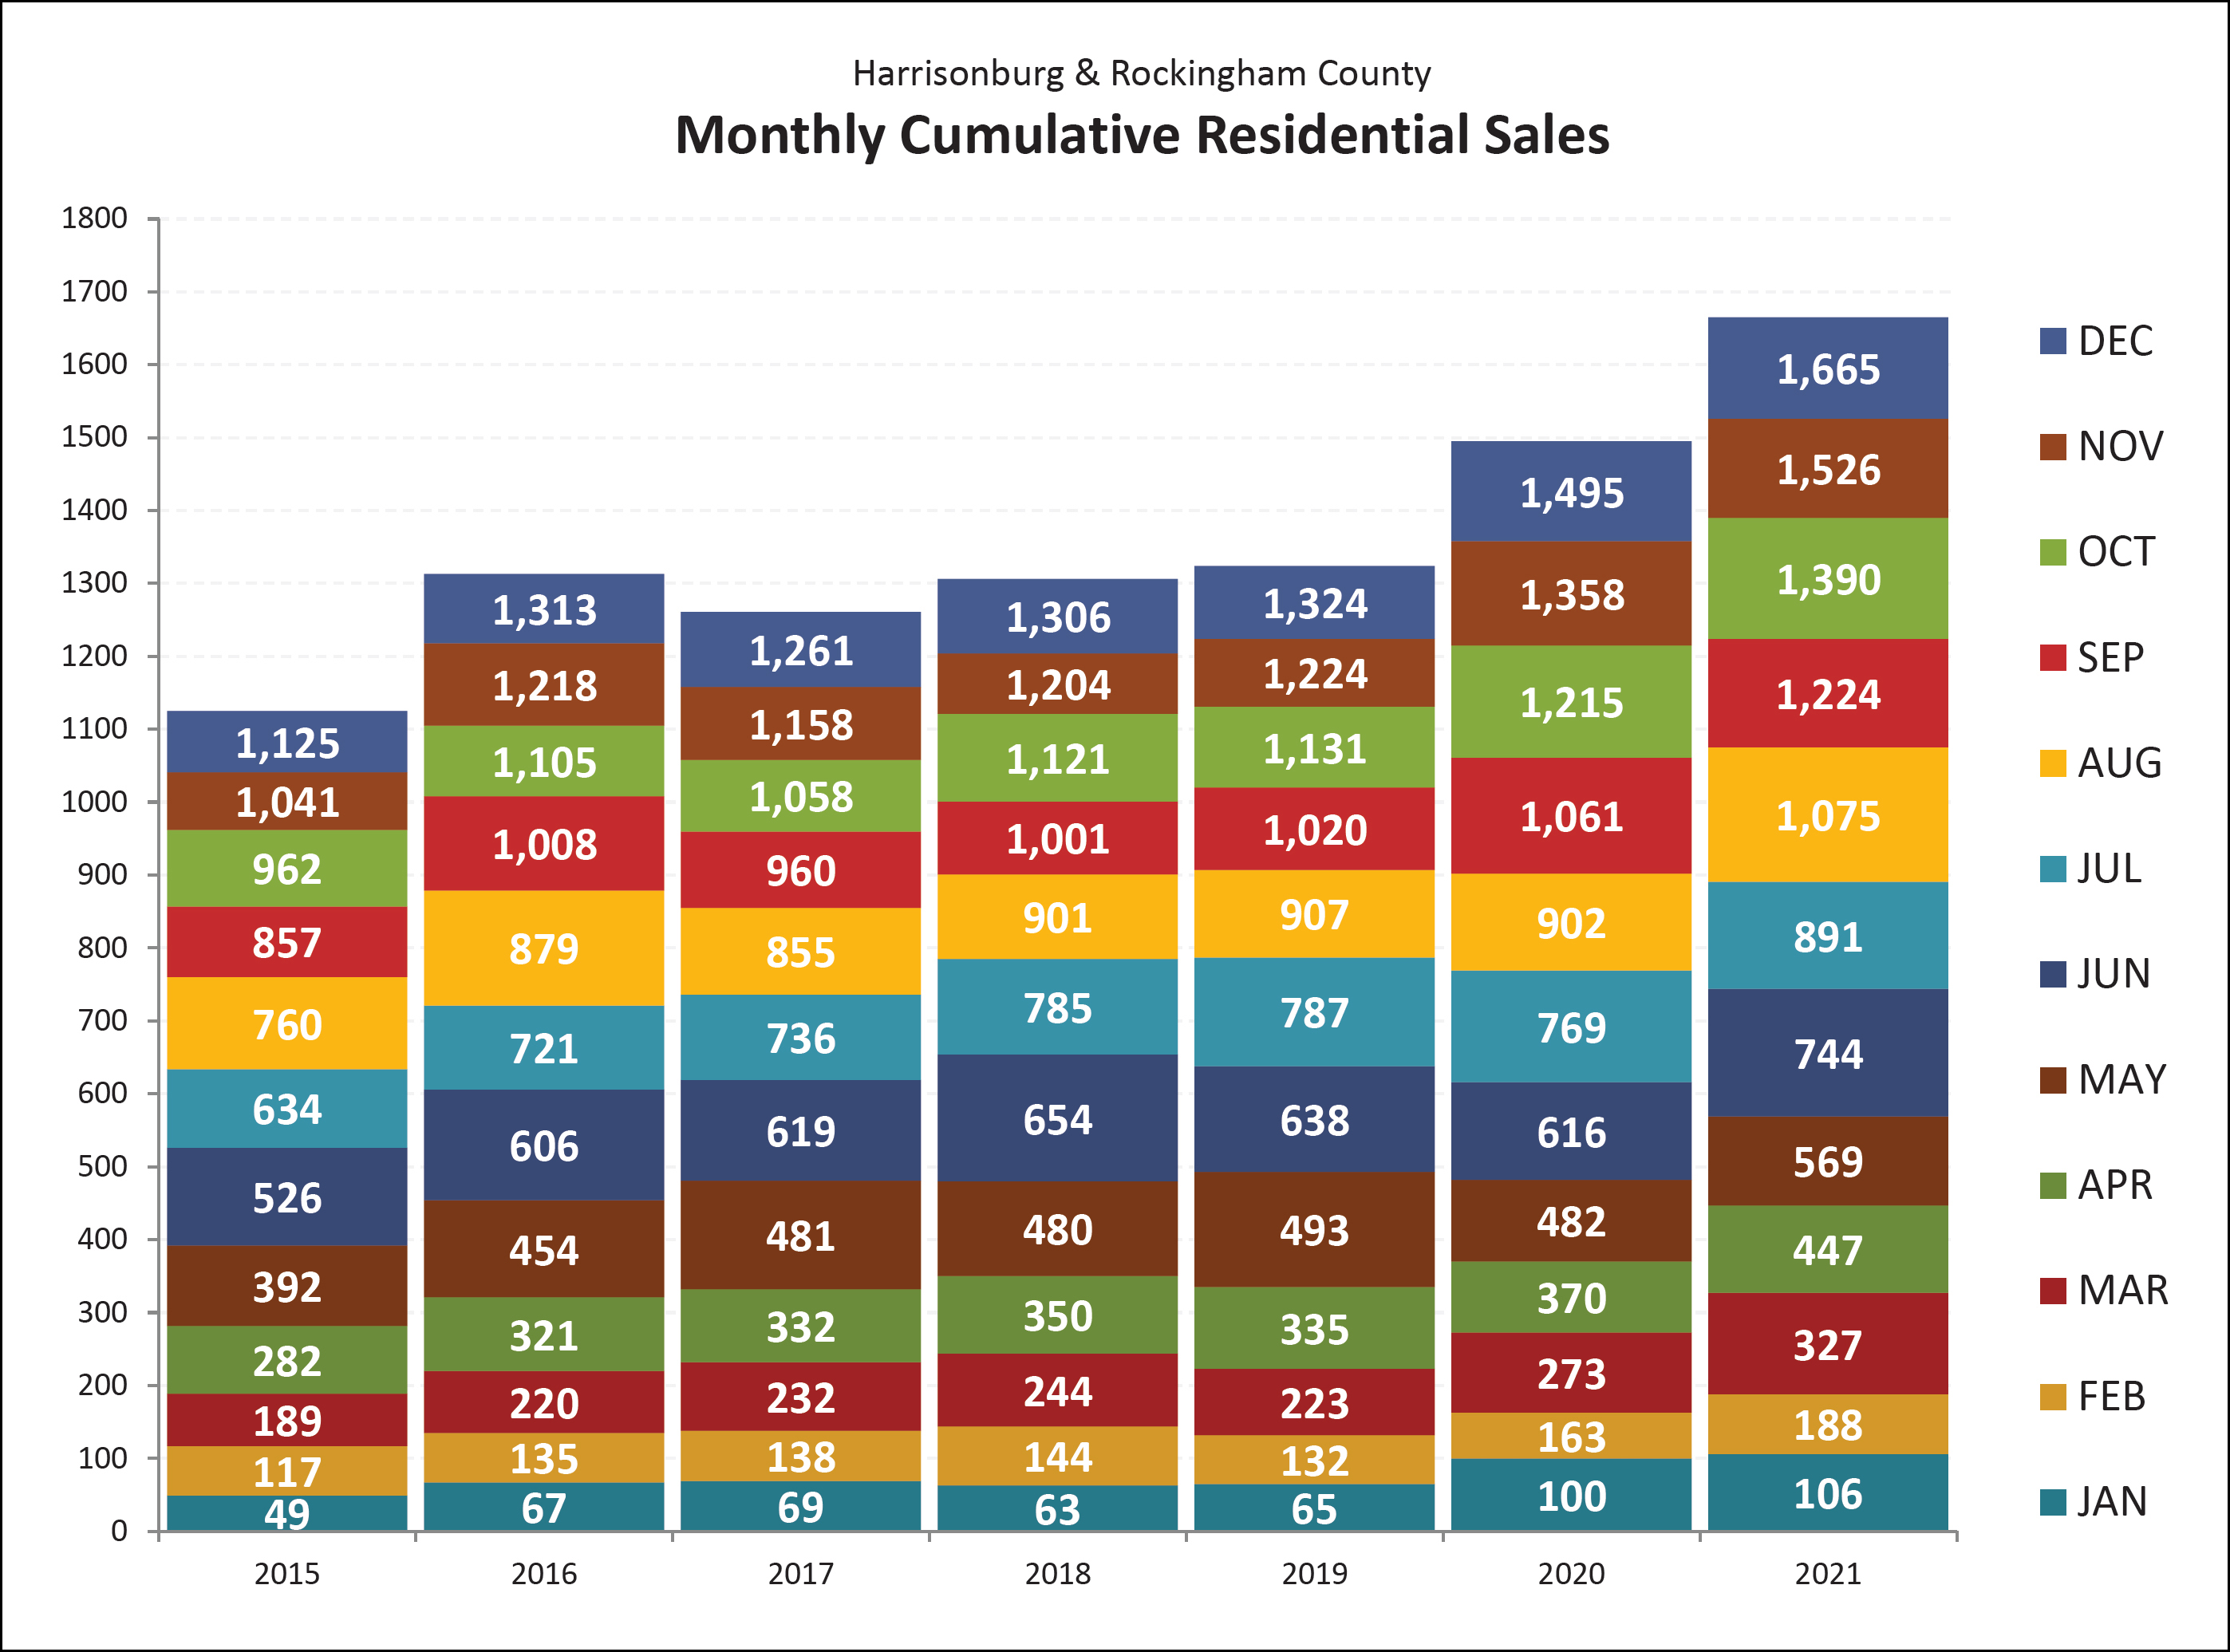
This colorful graph offers another way to look at the overall sales trends for the past few years in the Harrisonburg and Rockingham County housing market. Looking back, 2016 seemed like an exciting year with a 17% increase in sales compared to the prior year. Within that context, the 13% increase in home sales in 2020 doesn’t seem quite as extreme -- we have seen a larger increase in home sales in a single year in the past decade. But still, it was an unexpectedly strong year of home sales last year. Now, looking at all of 2021 home sales we see that home sales jumped up another 11% in 2021 -- much more than normal, but not as much as in 2020.
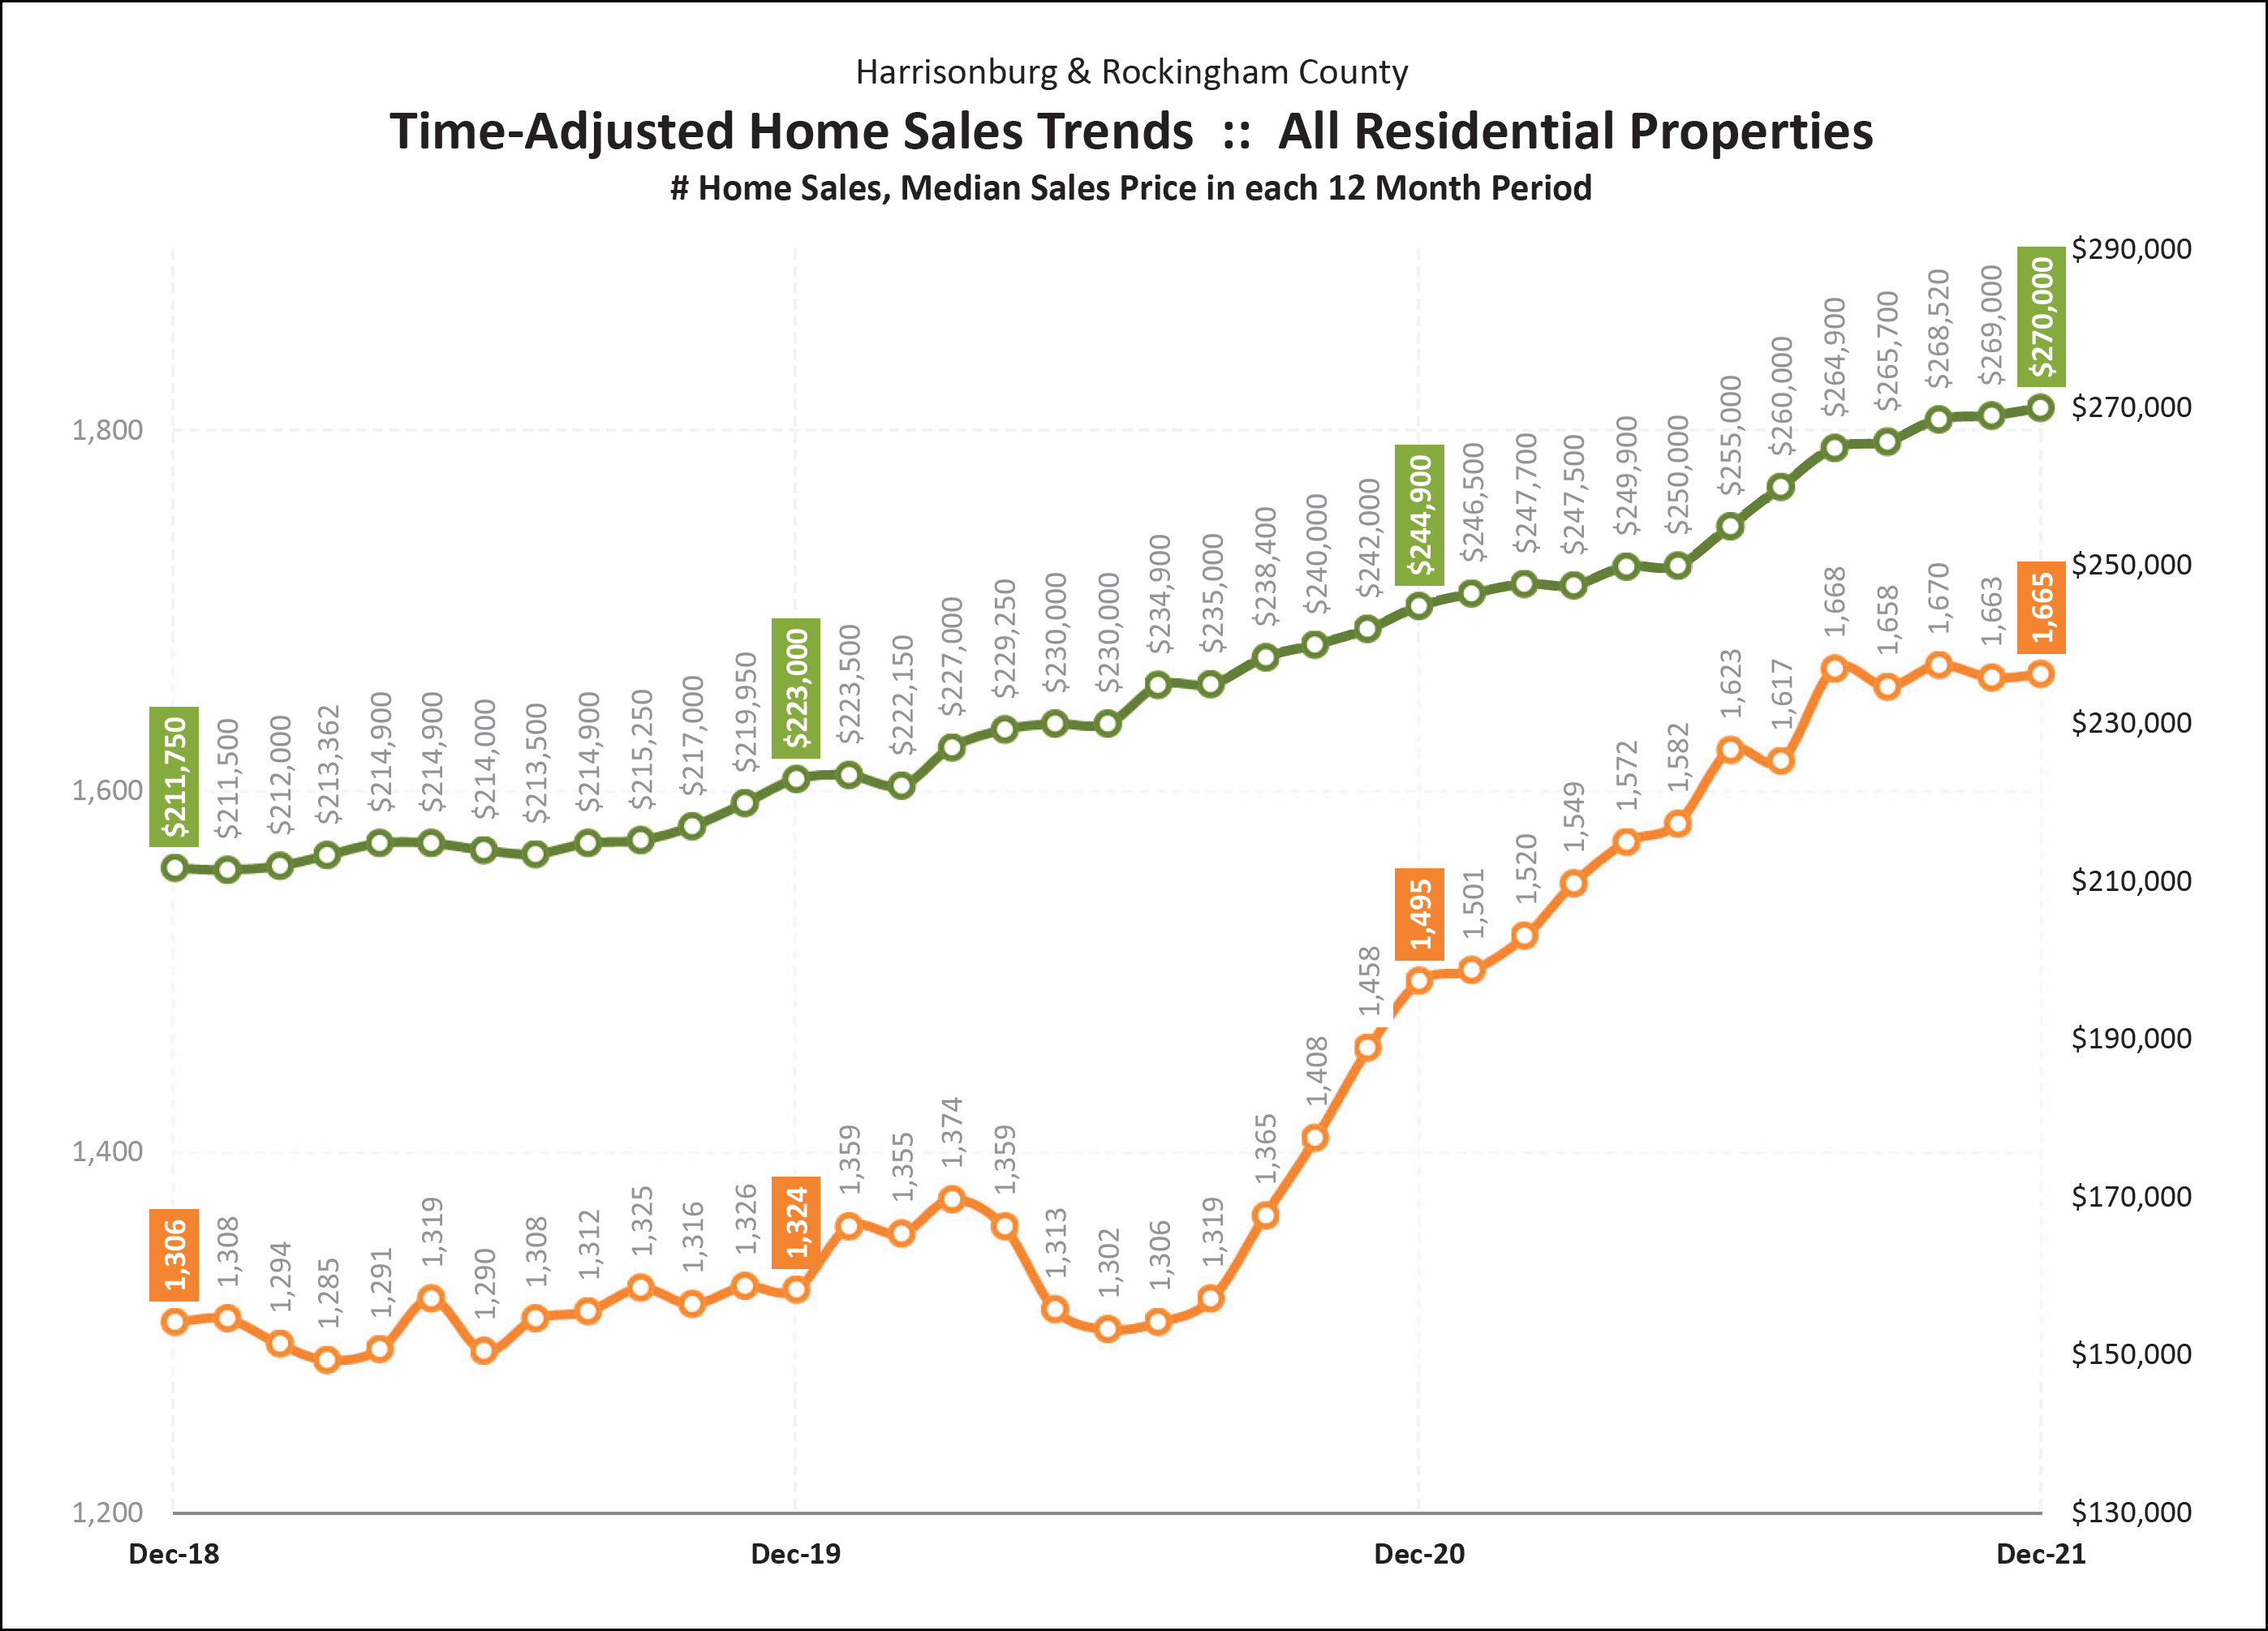
This graph shows a rolling 12 month trend line of the number of homes sold in the Harrisonburg and Rockingham County area, as well as the median price of the homes sold during these time frames. Each data point shows one year of home sales, which eliminates the volatility of evaluating sales figures on a monthly basis. The annual pace of home sales dropped off in late spring 2020 due to COVID but a few months later started rising quite rapidly, flying past 1,500 home sales per year and now has risen past 1,600 sales per year and is hovering around 1,650 sales per year! The median sales price has been trending upwards for several years now.
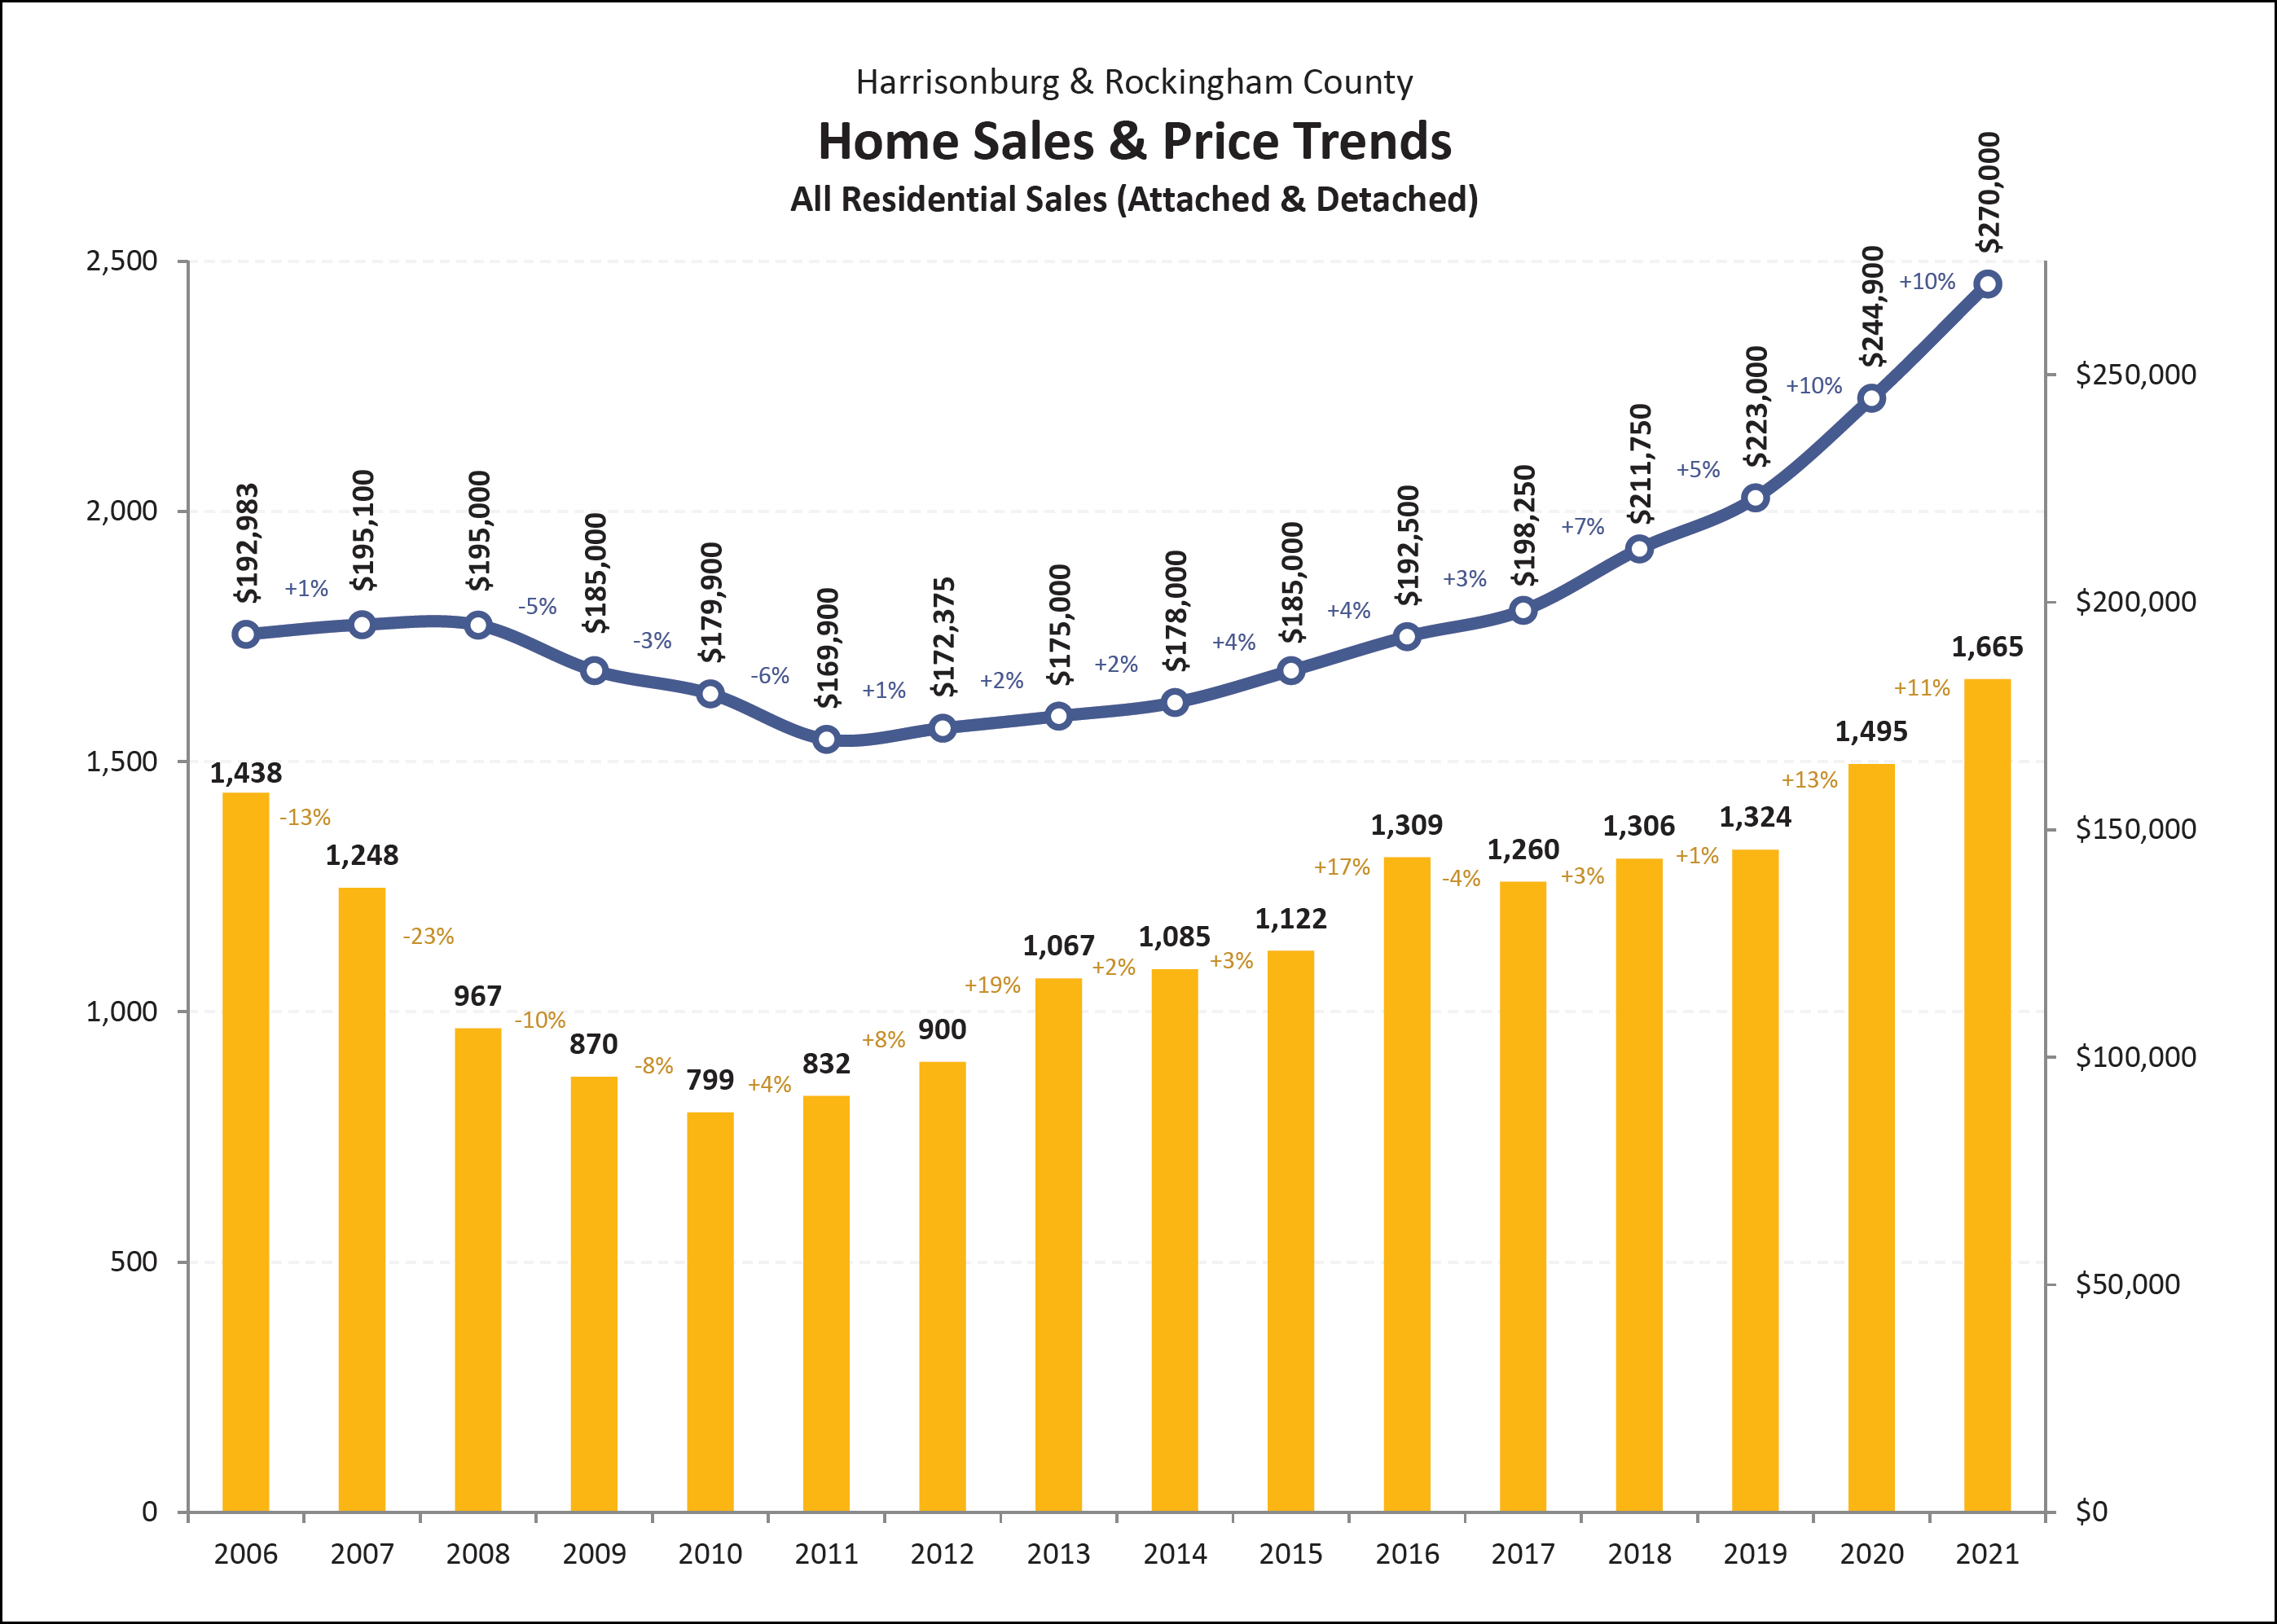
This graph provides an overall indicator of the state of our housing market, showing both the number of homes being sold each year since 2006 (yellow bars) as well as changes in the median sales price during the same time period (blue line). Over the past 10 years we have seen relatively steady increases in the number of homes sold each year in Harrisonburg and Rockingham County - with a larger than normal 13% increase in the pace of home sales in 2020 followed by another strong 11% increase in 2021. The median sales price has also been consistently increasing for ten years now, up to an all time high in 2021 of $270,000.
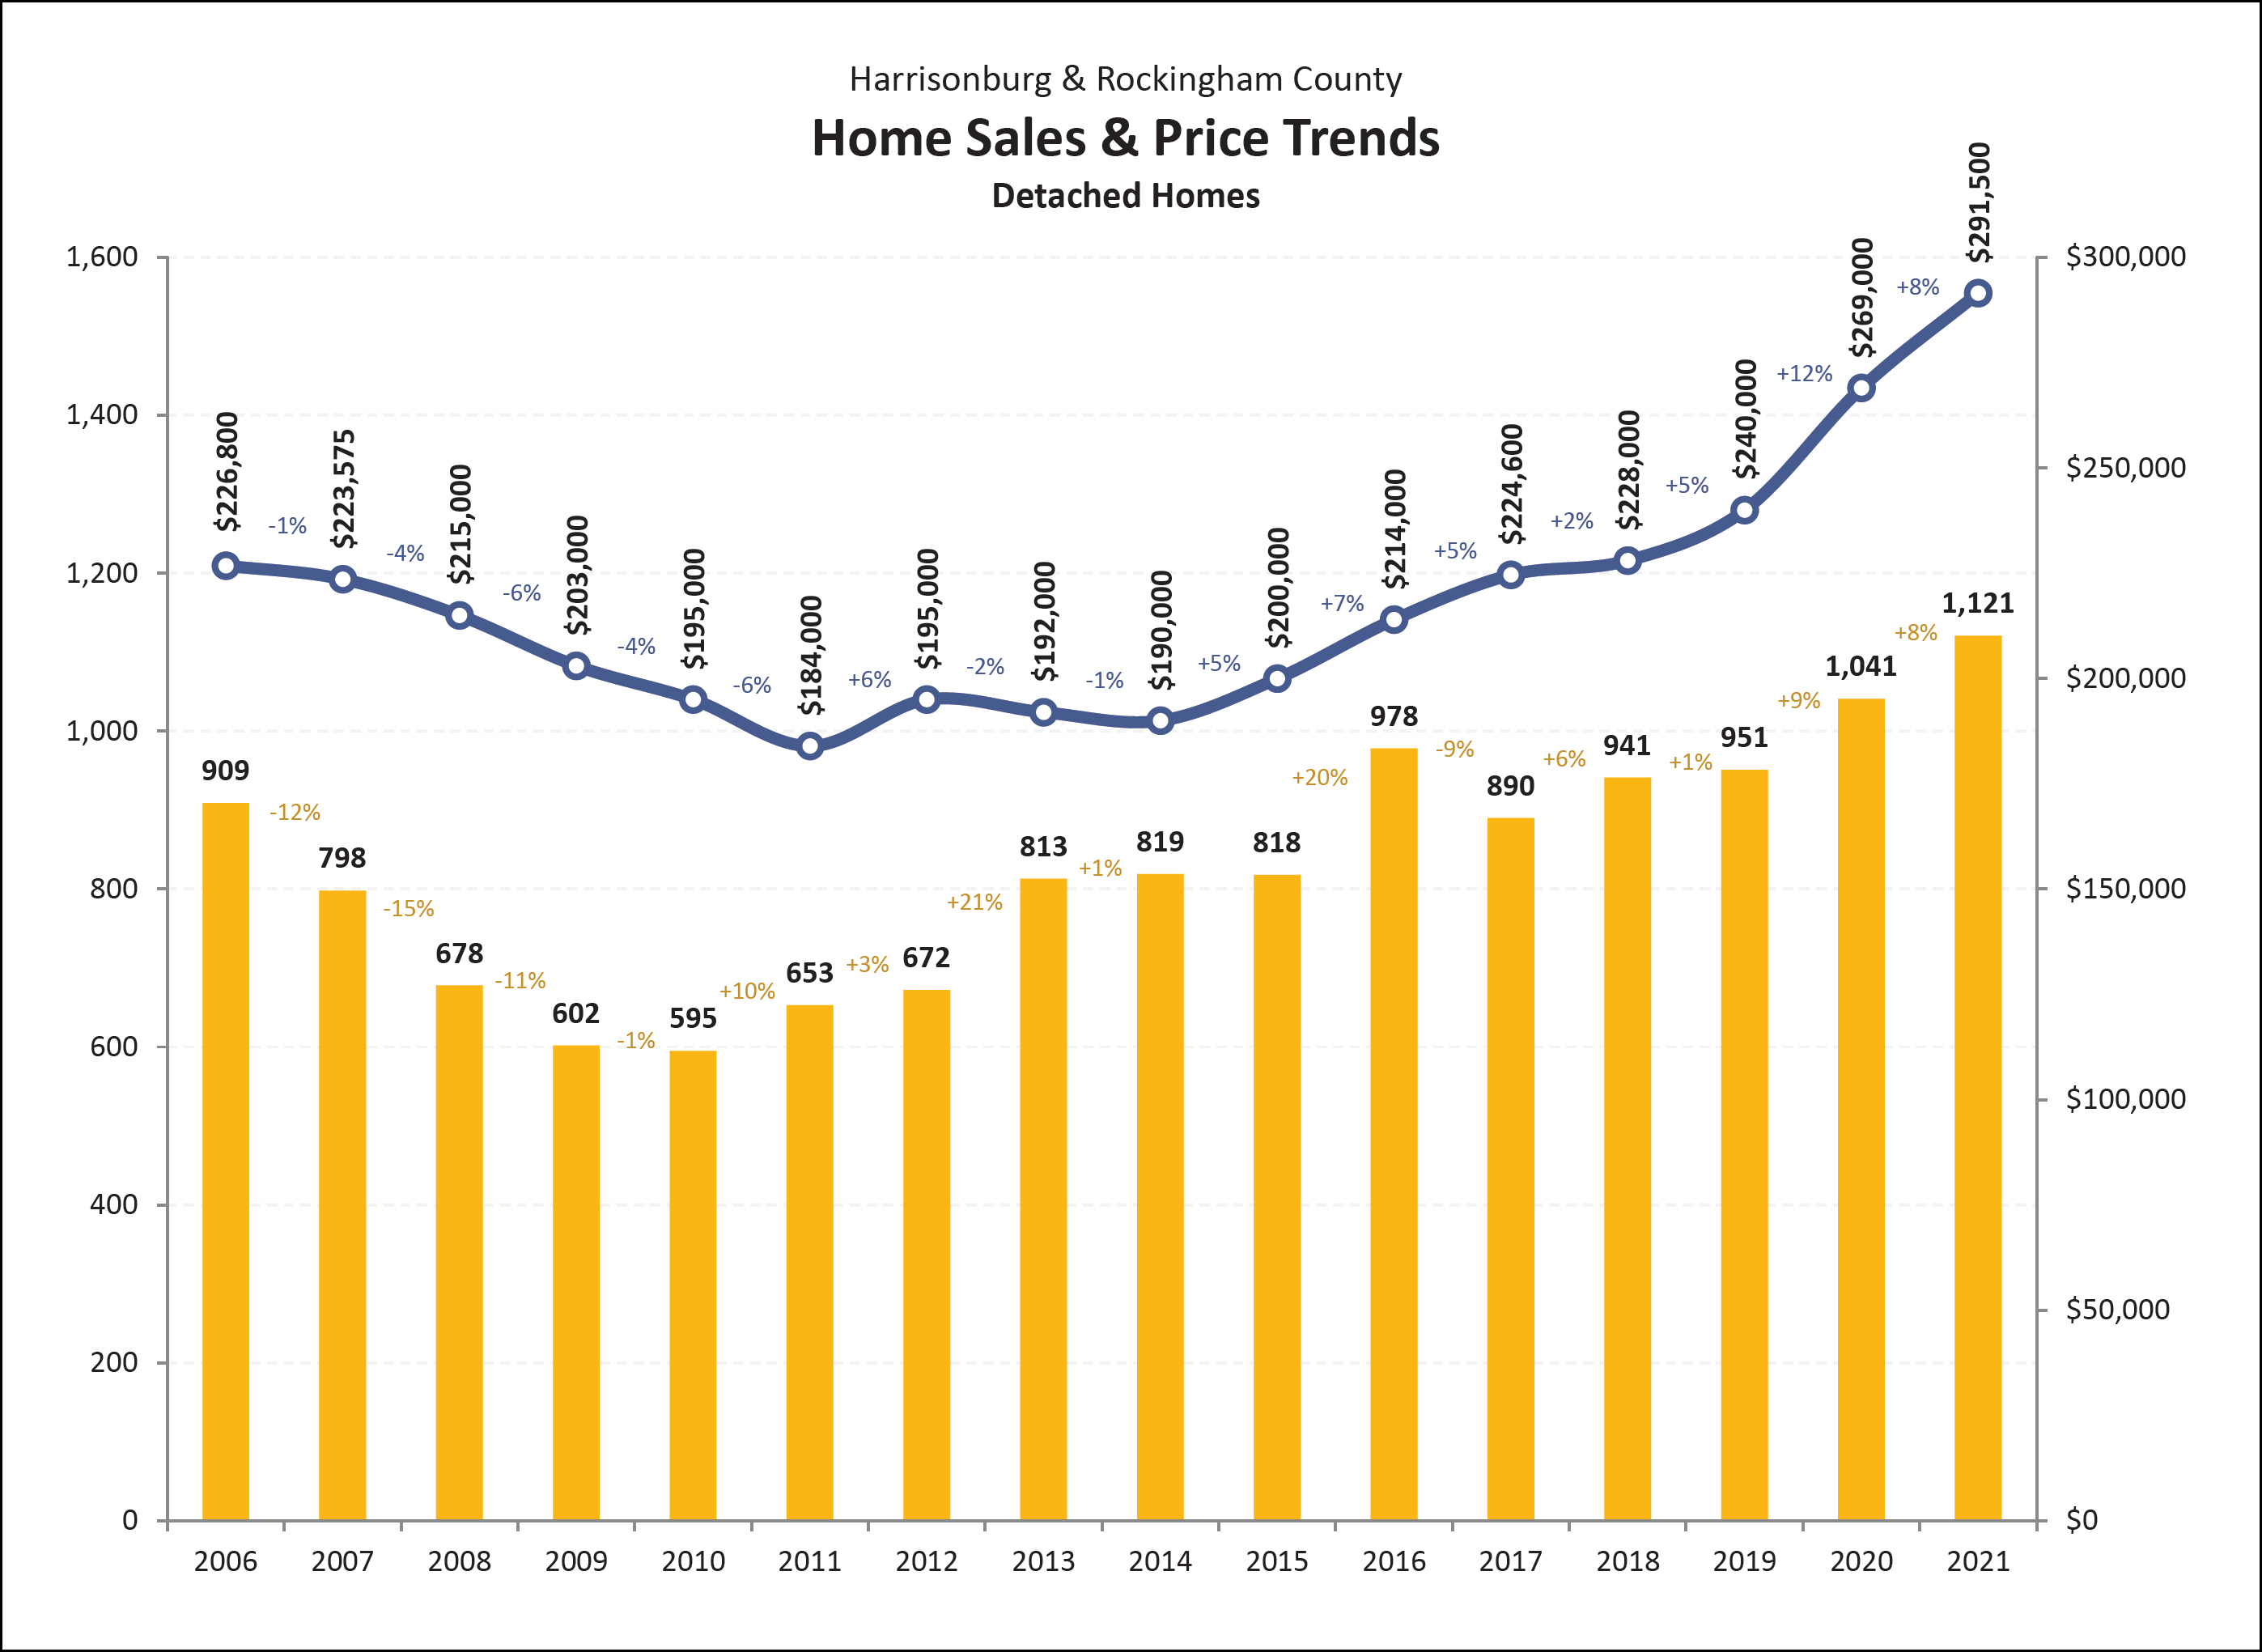
The single family home market in Harrisonburg and Rockingham County has improved rather steadily over the past 10 years with increases almost every year in the number of homes sold. After having peaked in 2016 with 978 home sales, we finally broke through 1,000 sales per year with 1,041 home sales in 2020 and we saw even more sales (1,121) in 2021. The median sales price has now been rising for seven years straight now, from $190,000 back in 2014 to a new (all time) high of $291,500 in 2020. The median sales price of detached homes rose 12% in 2020 and then 8% in 2021 leading to two strong back to back years of price increases.
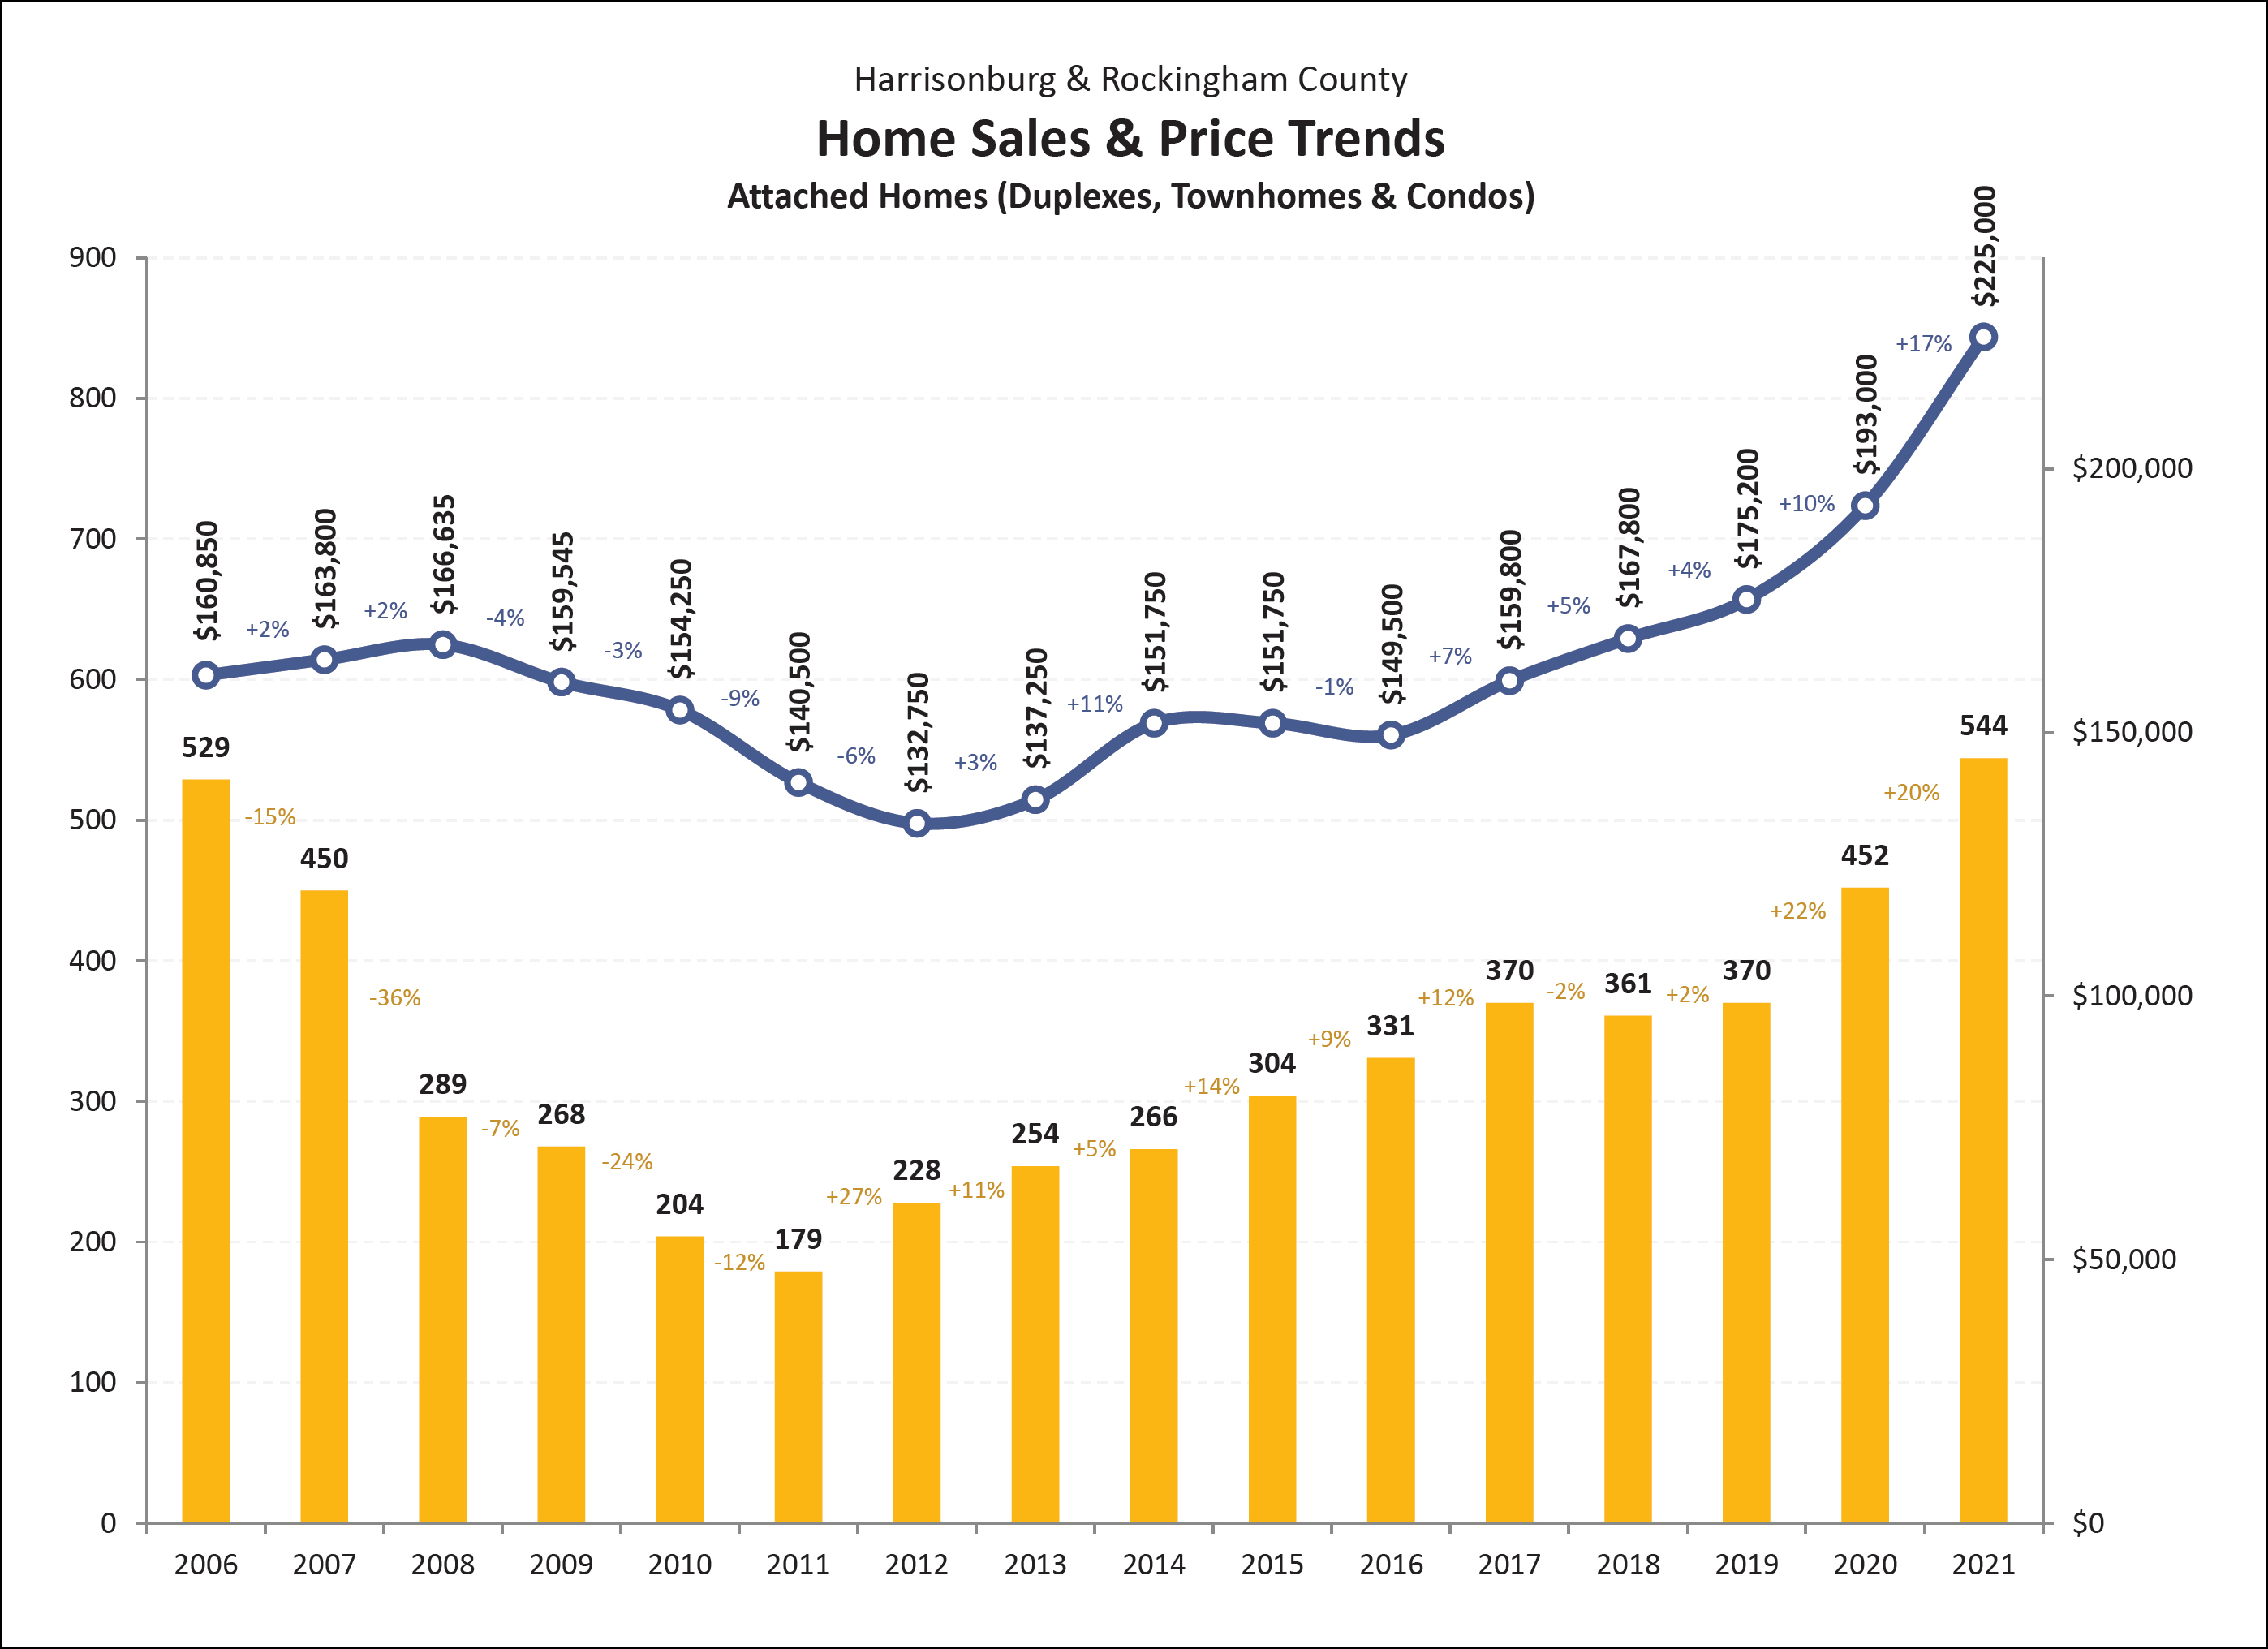
The pace of sales of attached homes (duplexes, townhouses and condos) rose steadily between 2011 and 2017 and then plateaued for a few years right around 370 home sales per year. But then, 2020. The sales of attached homes jumped significantly in 2020, showing a 22% year over year increase, with 452 home sales. This 22% increase in sales in 2020 was only slightly higher than the 20% increase in attached sales seen in 2021. The median sales price of attached homes has been rising (for the most part) for nine years now and has hit a new (all time) high of $225,000 in 2021, up from less than $150,000 only five years ago.
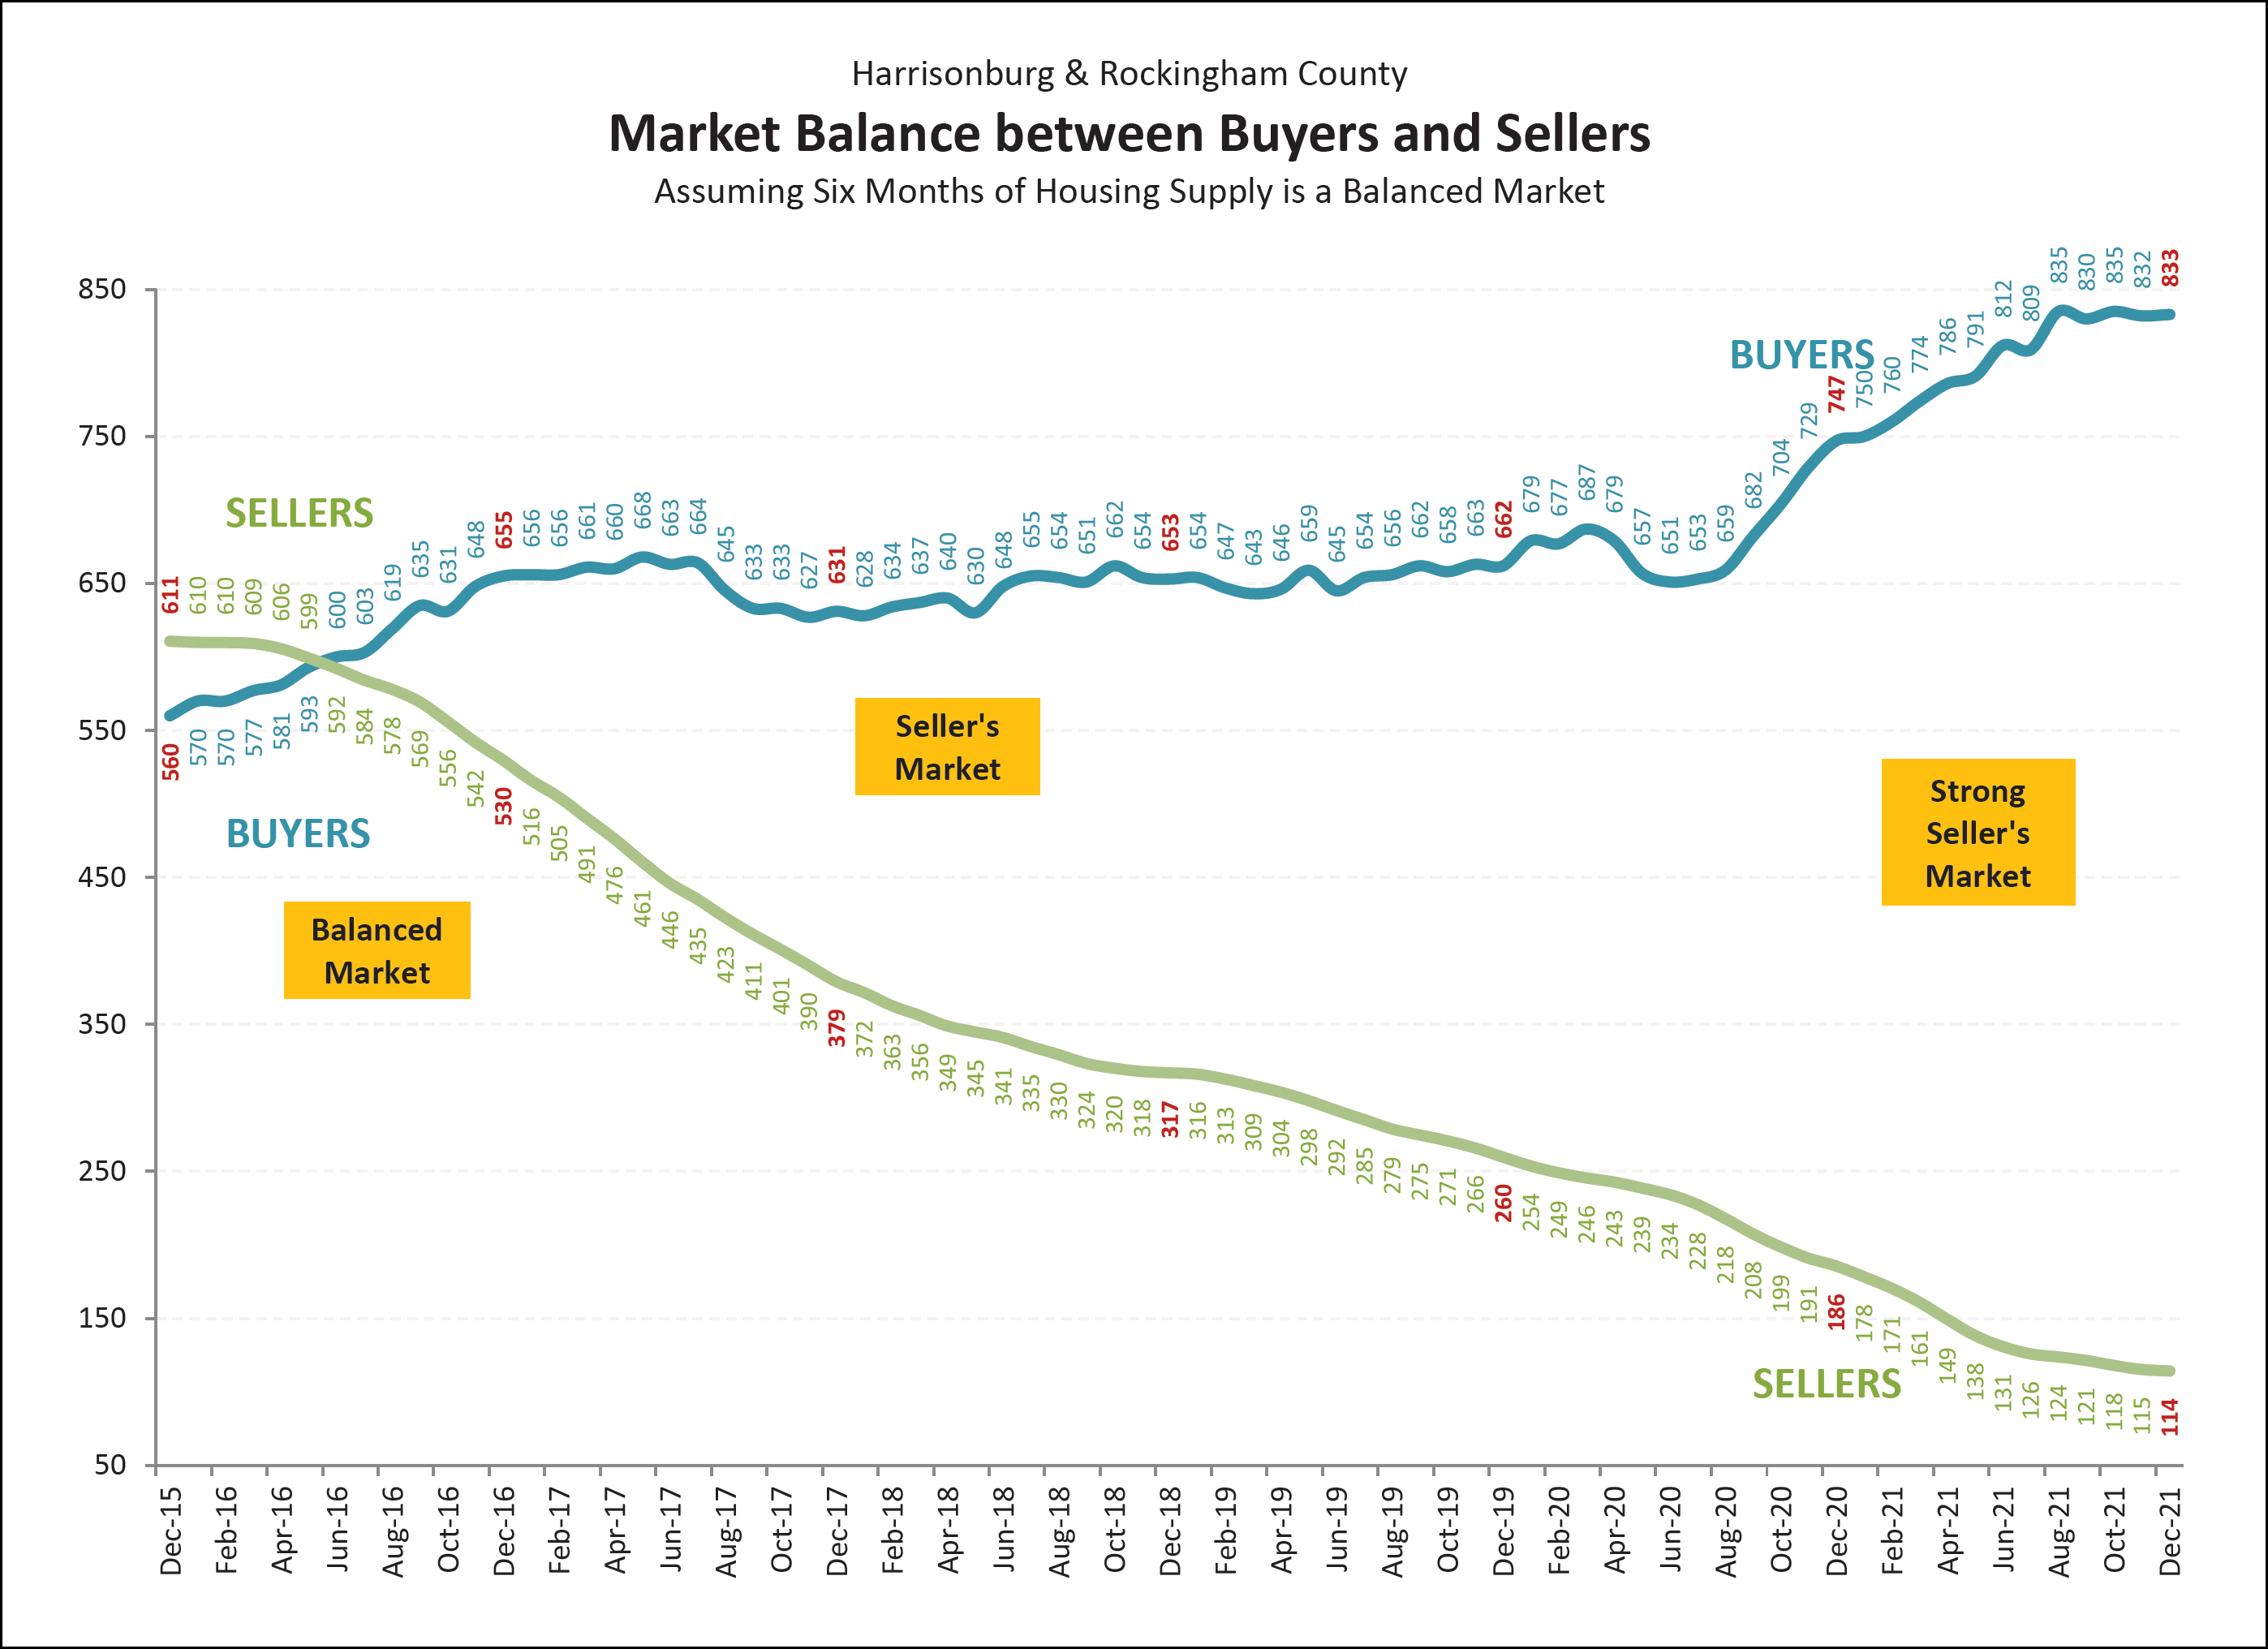
Historically, well before Covid, many had considered six months of inventory (active listings) to be an indicator of a balanced market between buyers and sellers, but many are reconsidering that metric now. The “BUYERS” trend line above shows how many buyers are buying in a six month period. The “SELLERS” trend line above shows how many sellers are in the market (active listings) at any given time. Over the past several years we have seen a steady increase in buyers and a declining number of sellers. We now see many (many!) more buyers buying in a six month period than there are homes for sale at any given time.
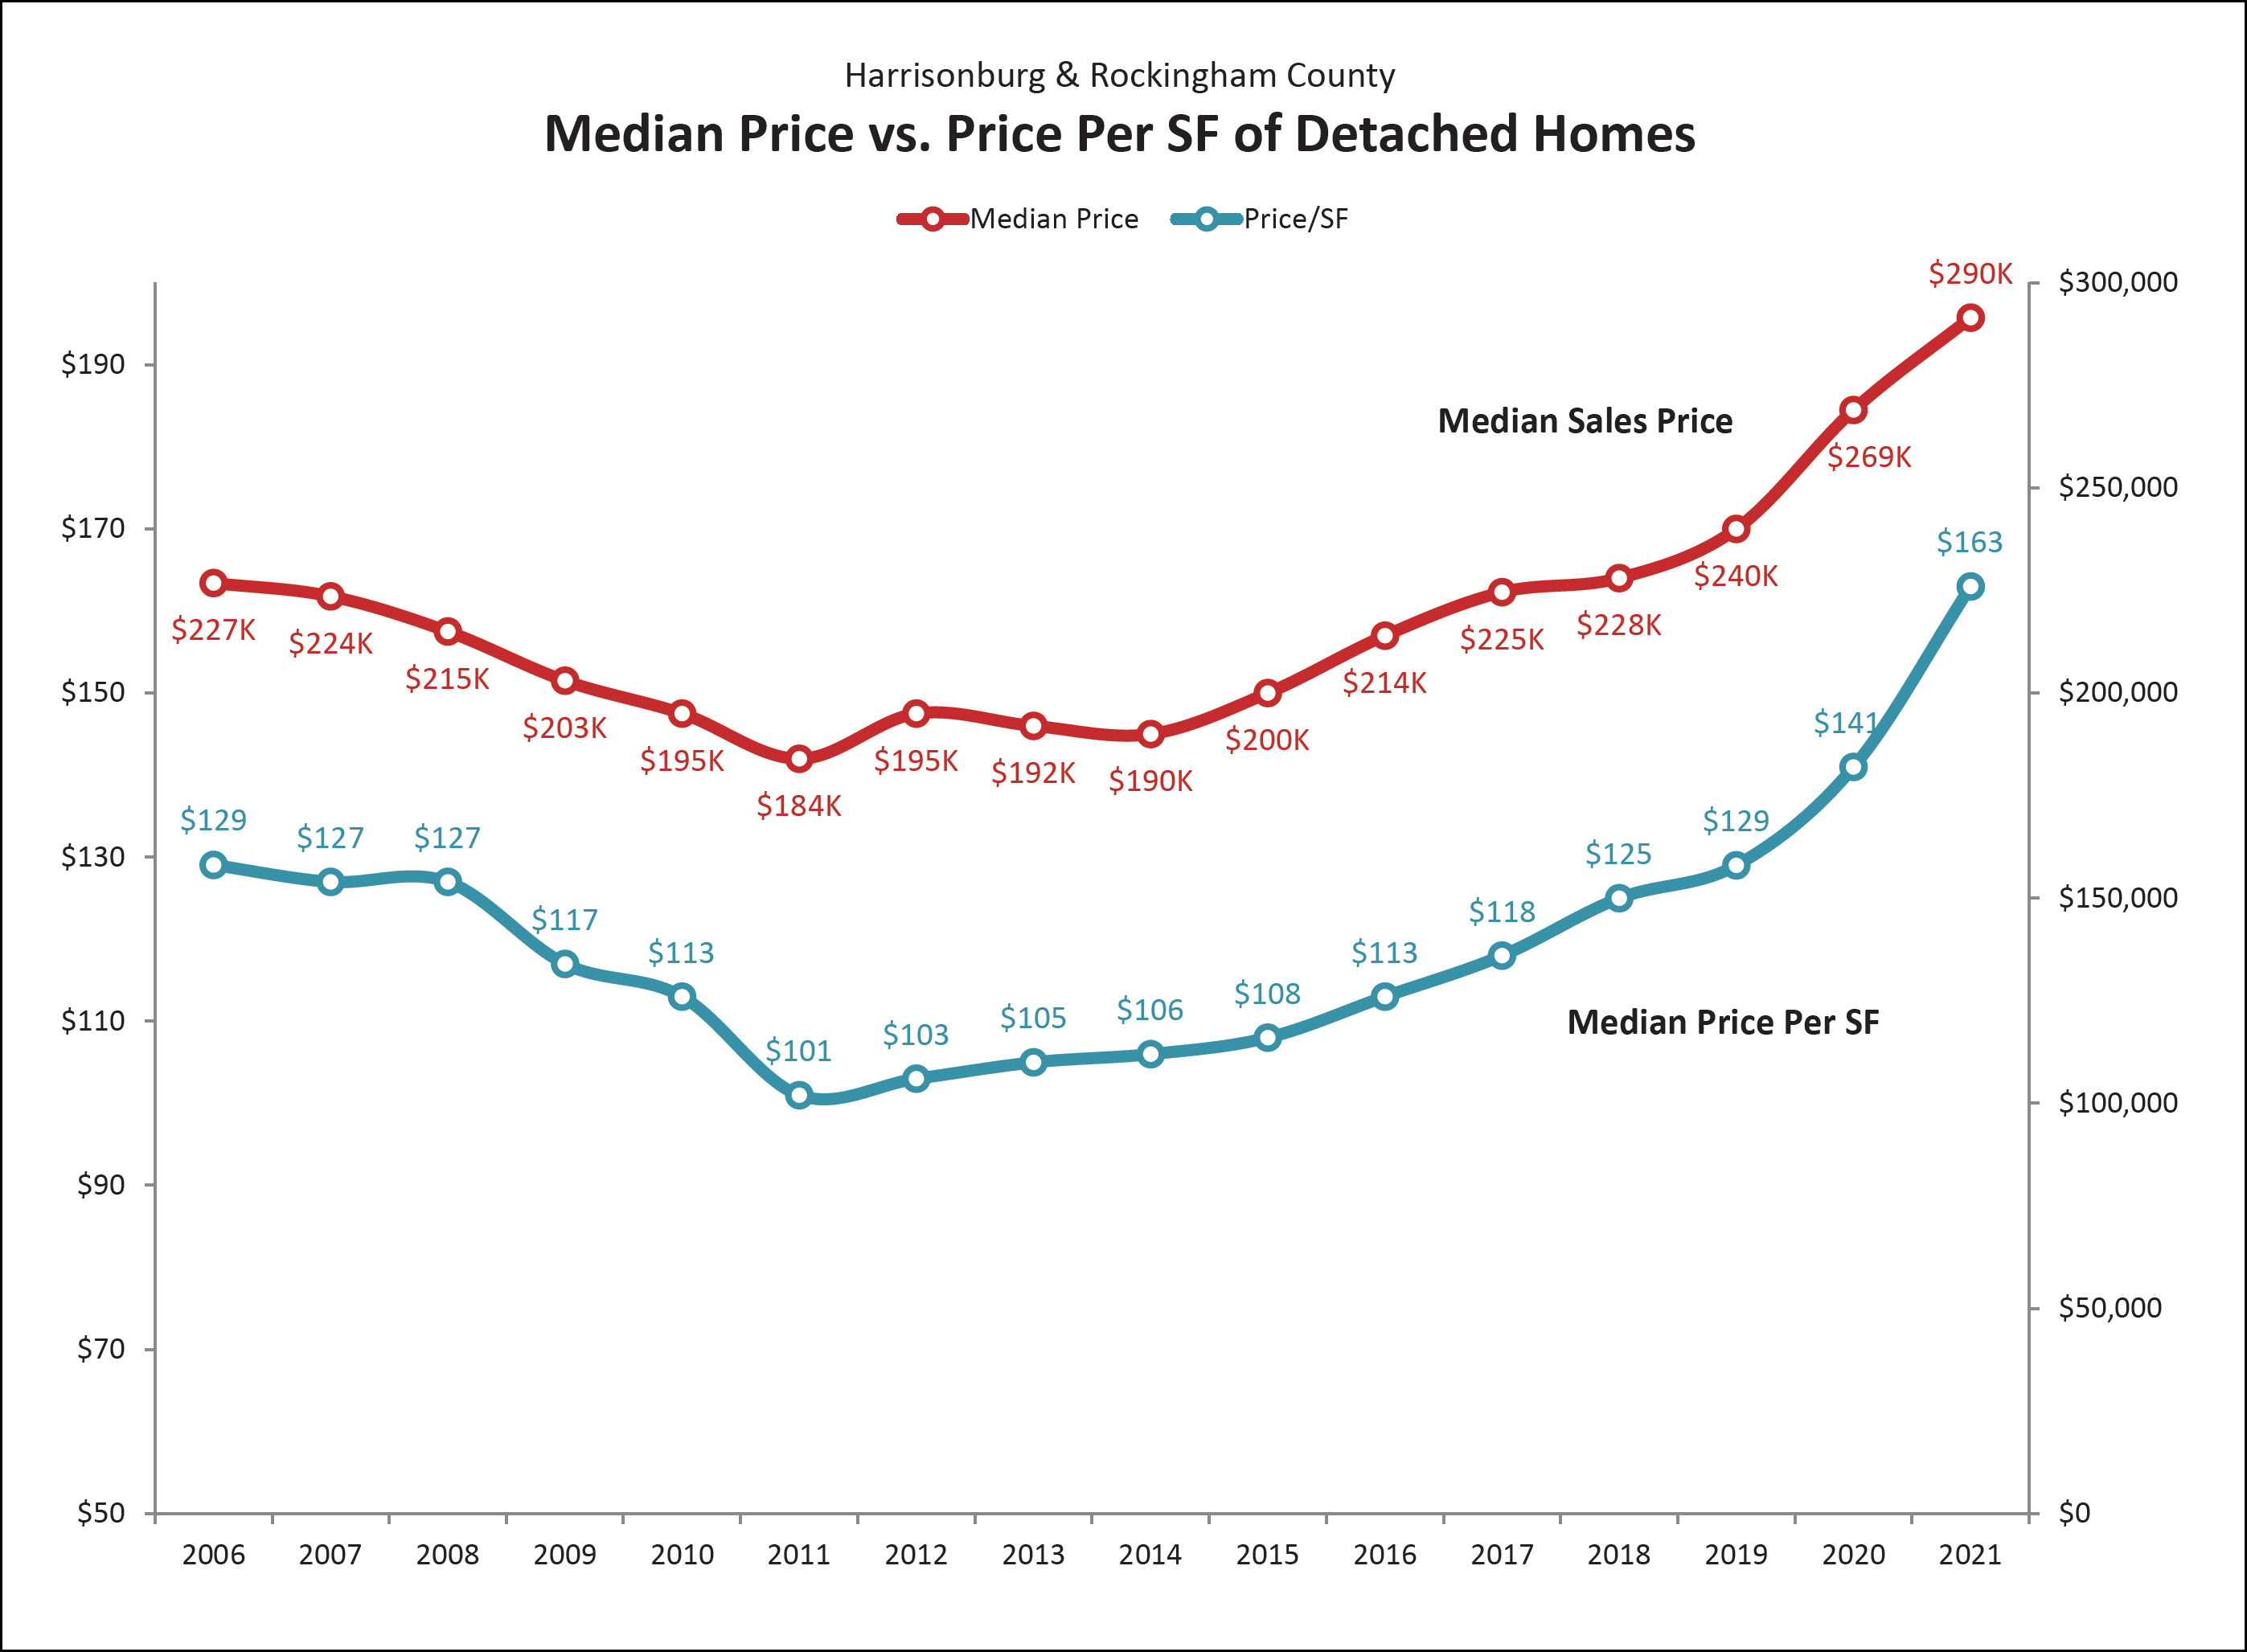
In addition to monitoring home values by overall median sales prices in our market, it can be insightful to examine the median price per square foot of homes that are selling. The graph above shows the median price per square foot of all single family homes sold over the past 15 years. The value trend captured by this graph is quite similar to the trend shown in the single family home median sales price during the same time, which validates that assumed set of changes in home values. Over the past several years (2015 through 2021) we have seen increases in the median sales price as well as the median price per square foot of single family homes.
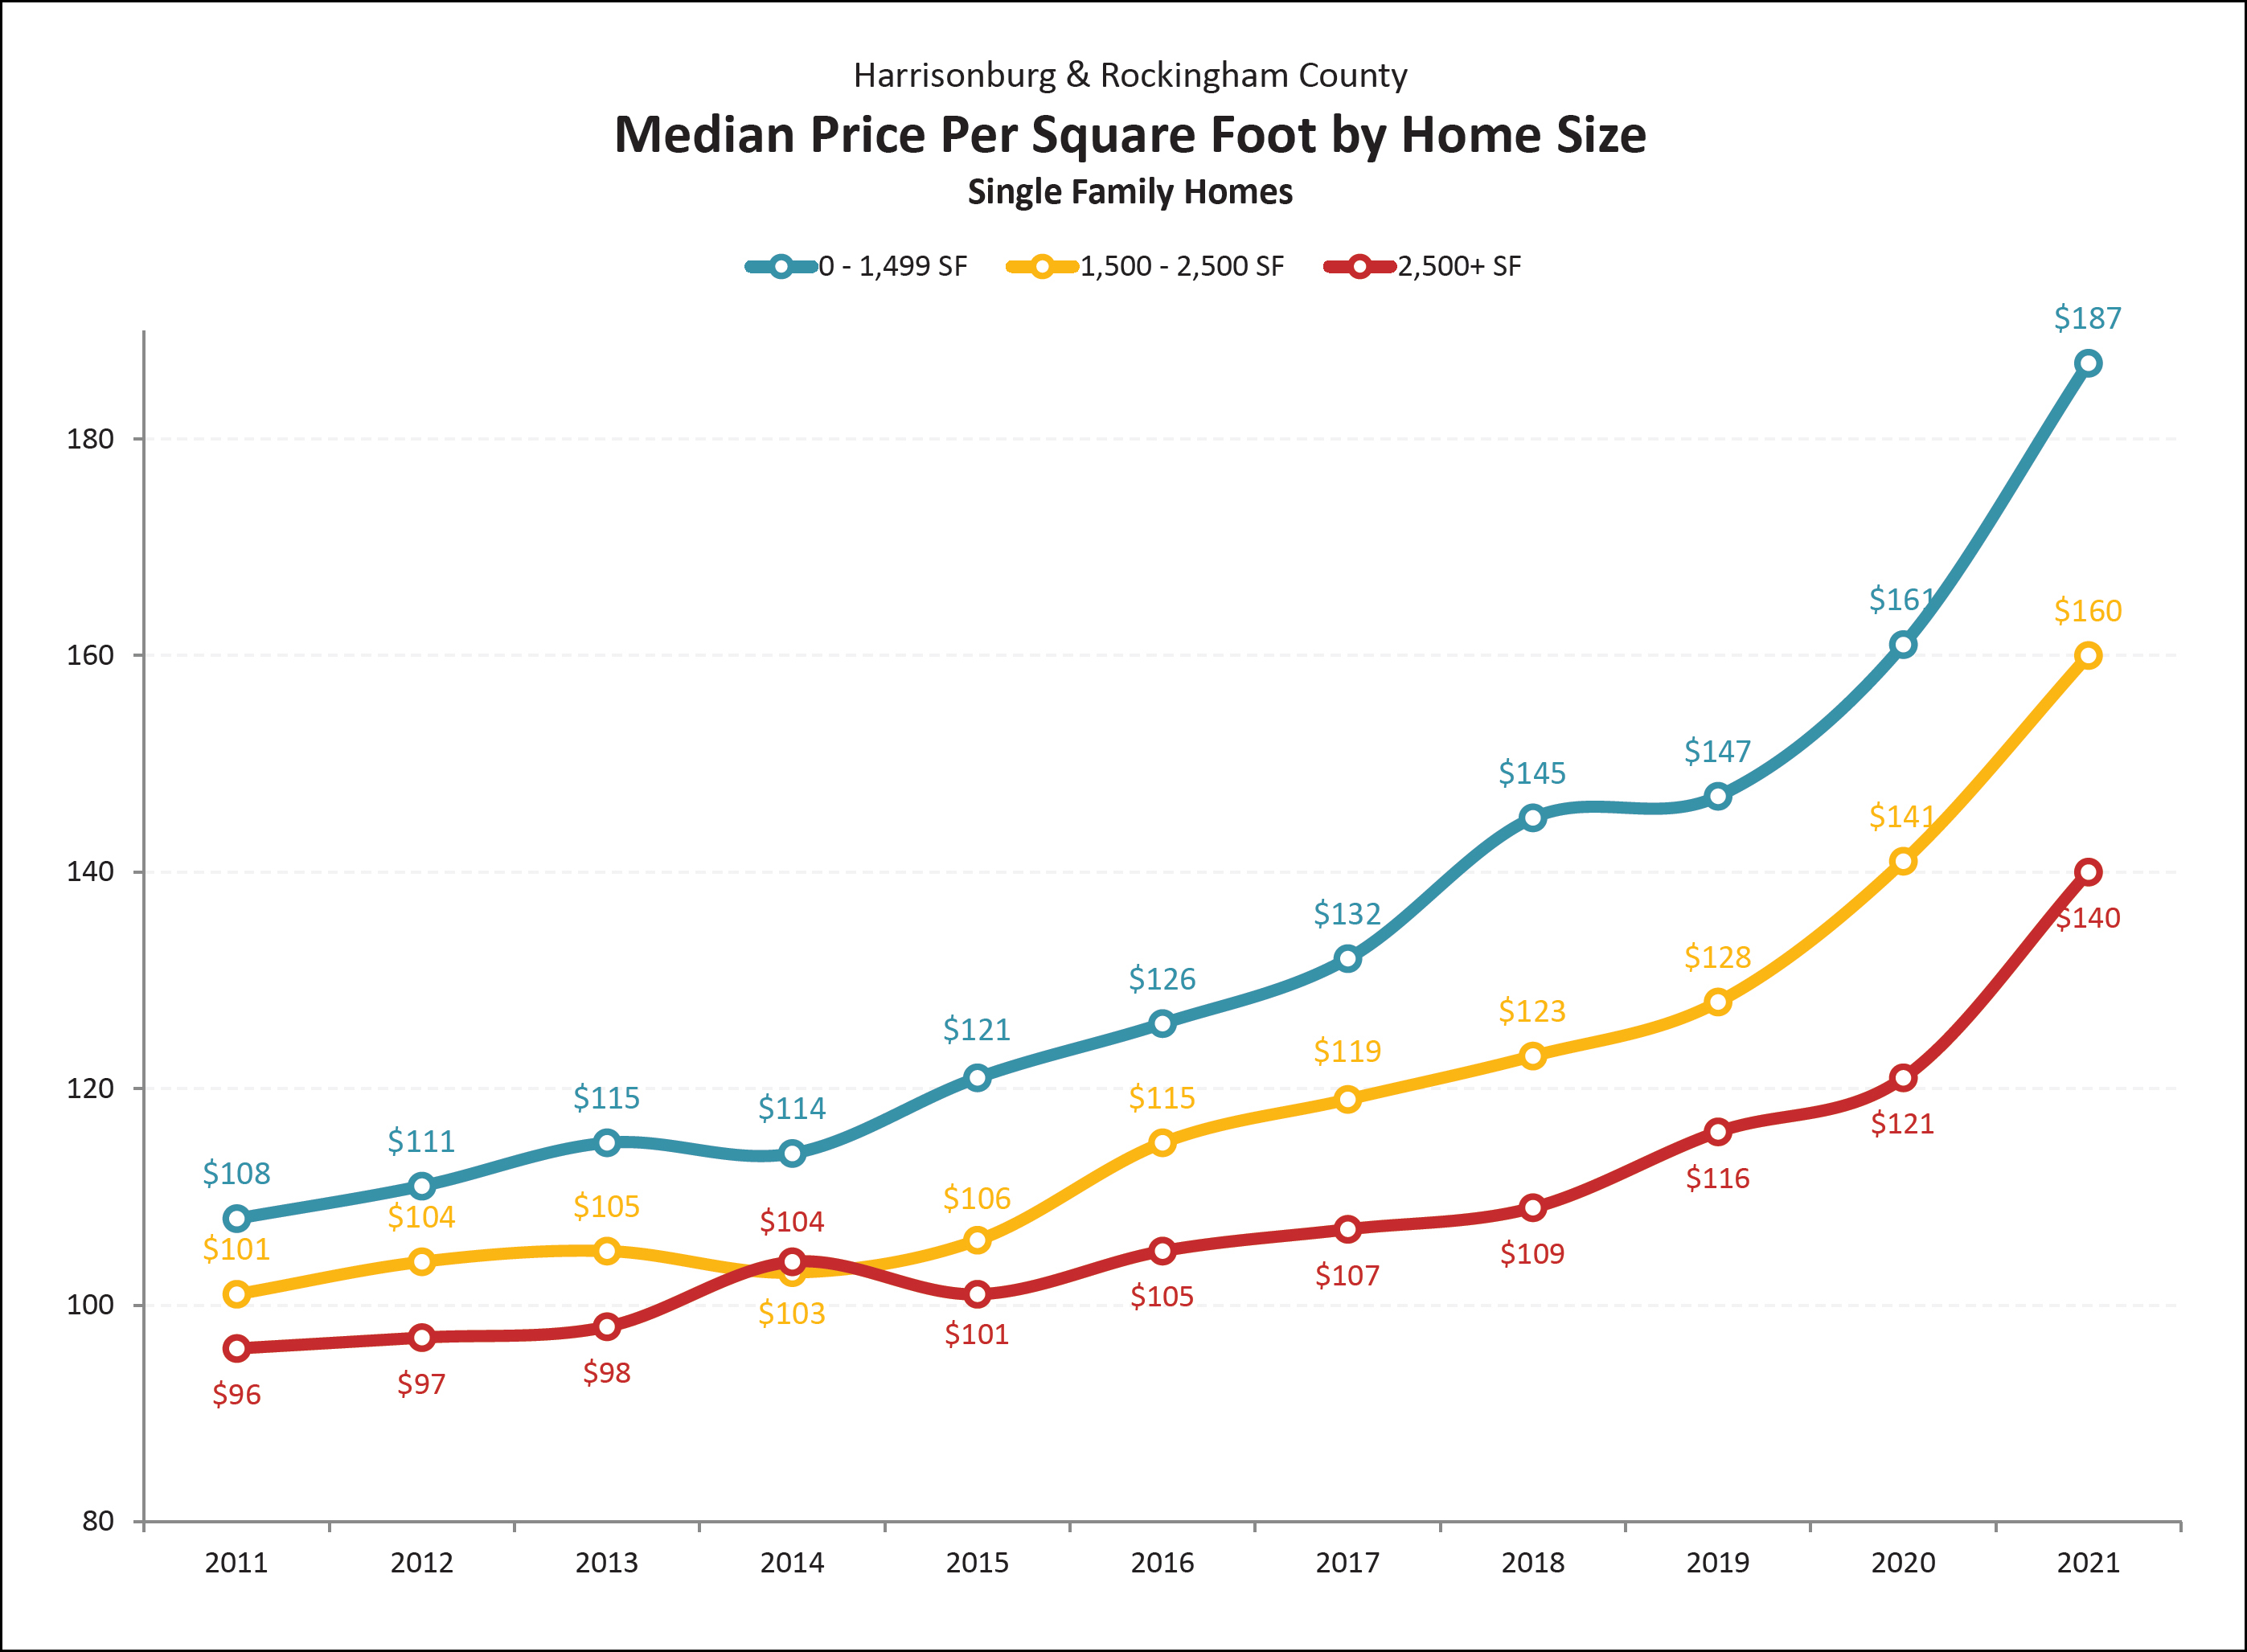
Price per square foot of single family homes certainly varies for many reasons, including the age, location, lot size and structural characteristics of each home sold. However, there are some similarities in homes of similar sizes. Looking at 2020 figures, this graph illustrates that the median price per square foot of larger homes (2500+ SF) was a good bit lower ($140/SF) than that of homes with less than 1500 SF ($187/SF) during 2020. These values cannot be used as an absolute standard against which the value of any home can be measured, but they can provide some helpful guidance when trying to determine the value of a home.
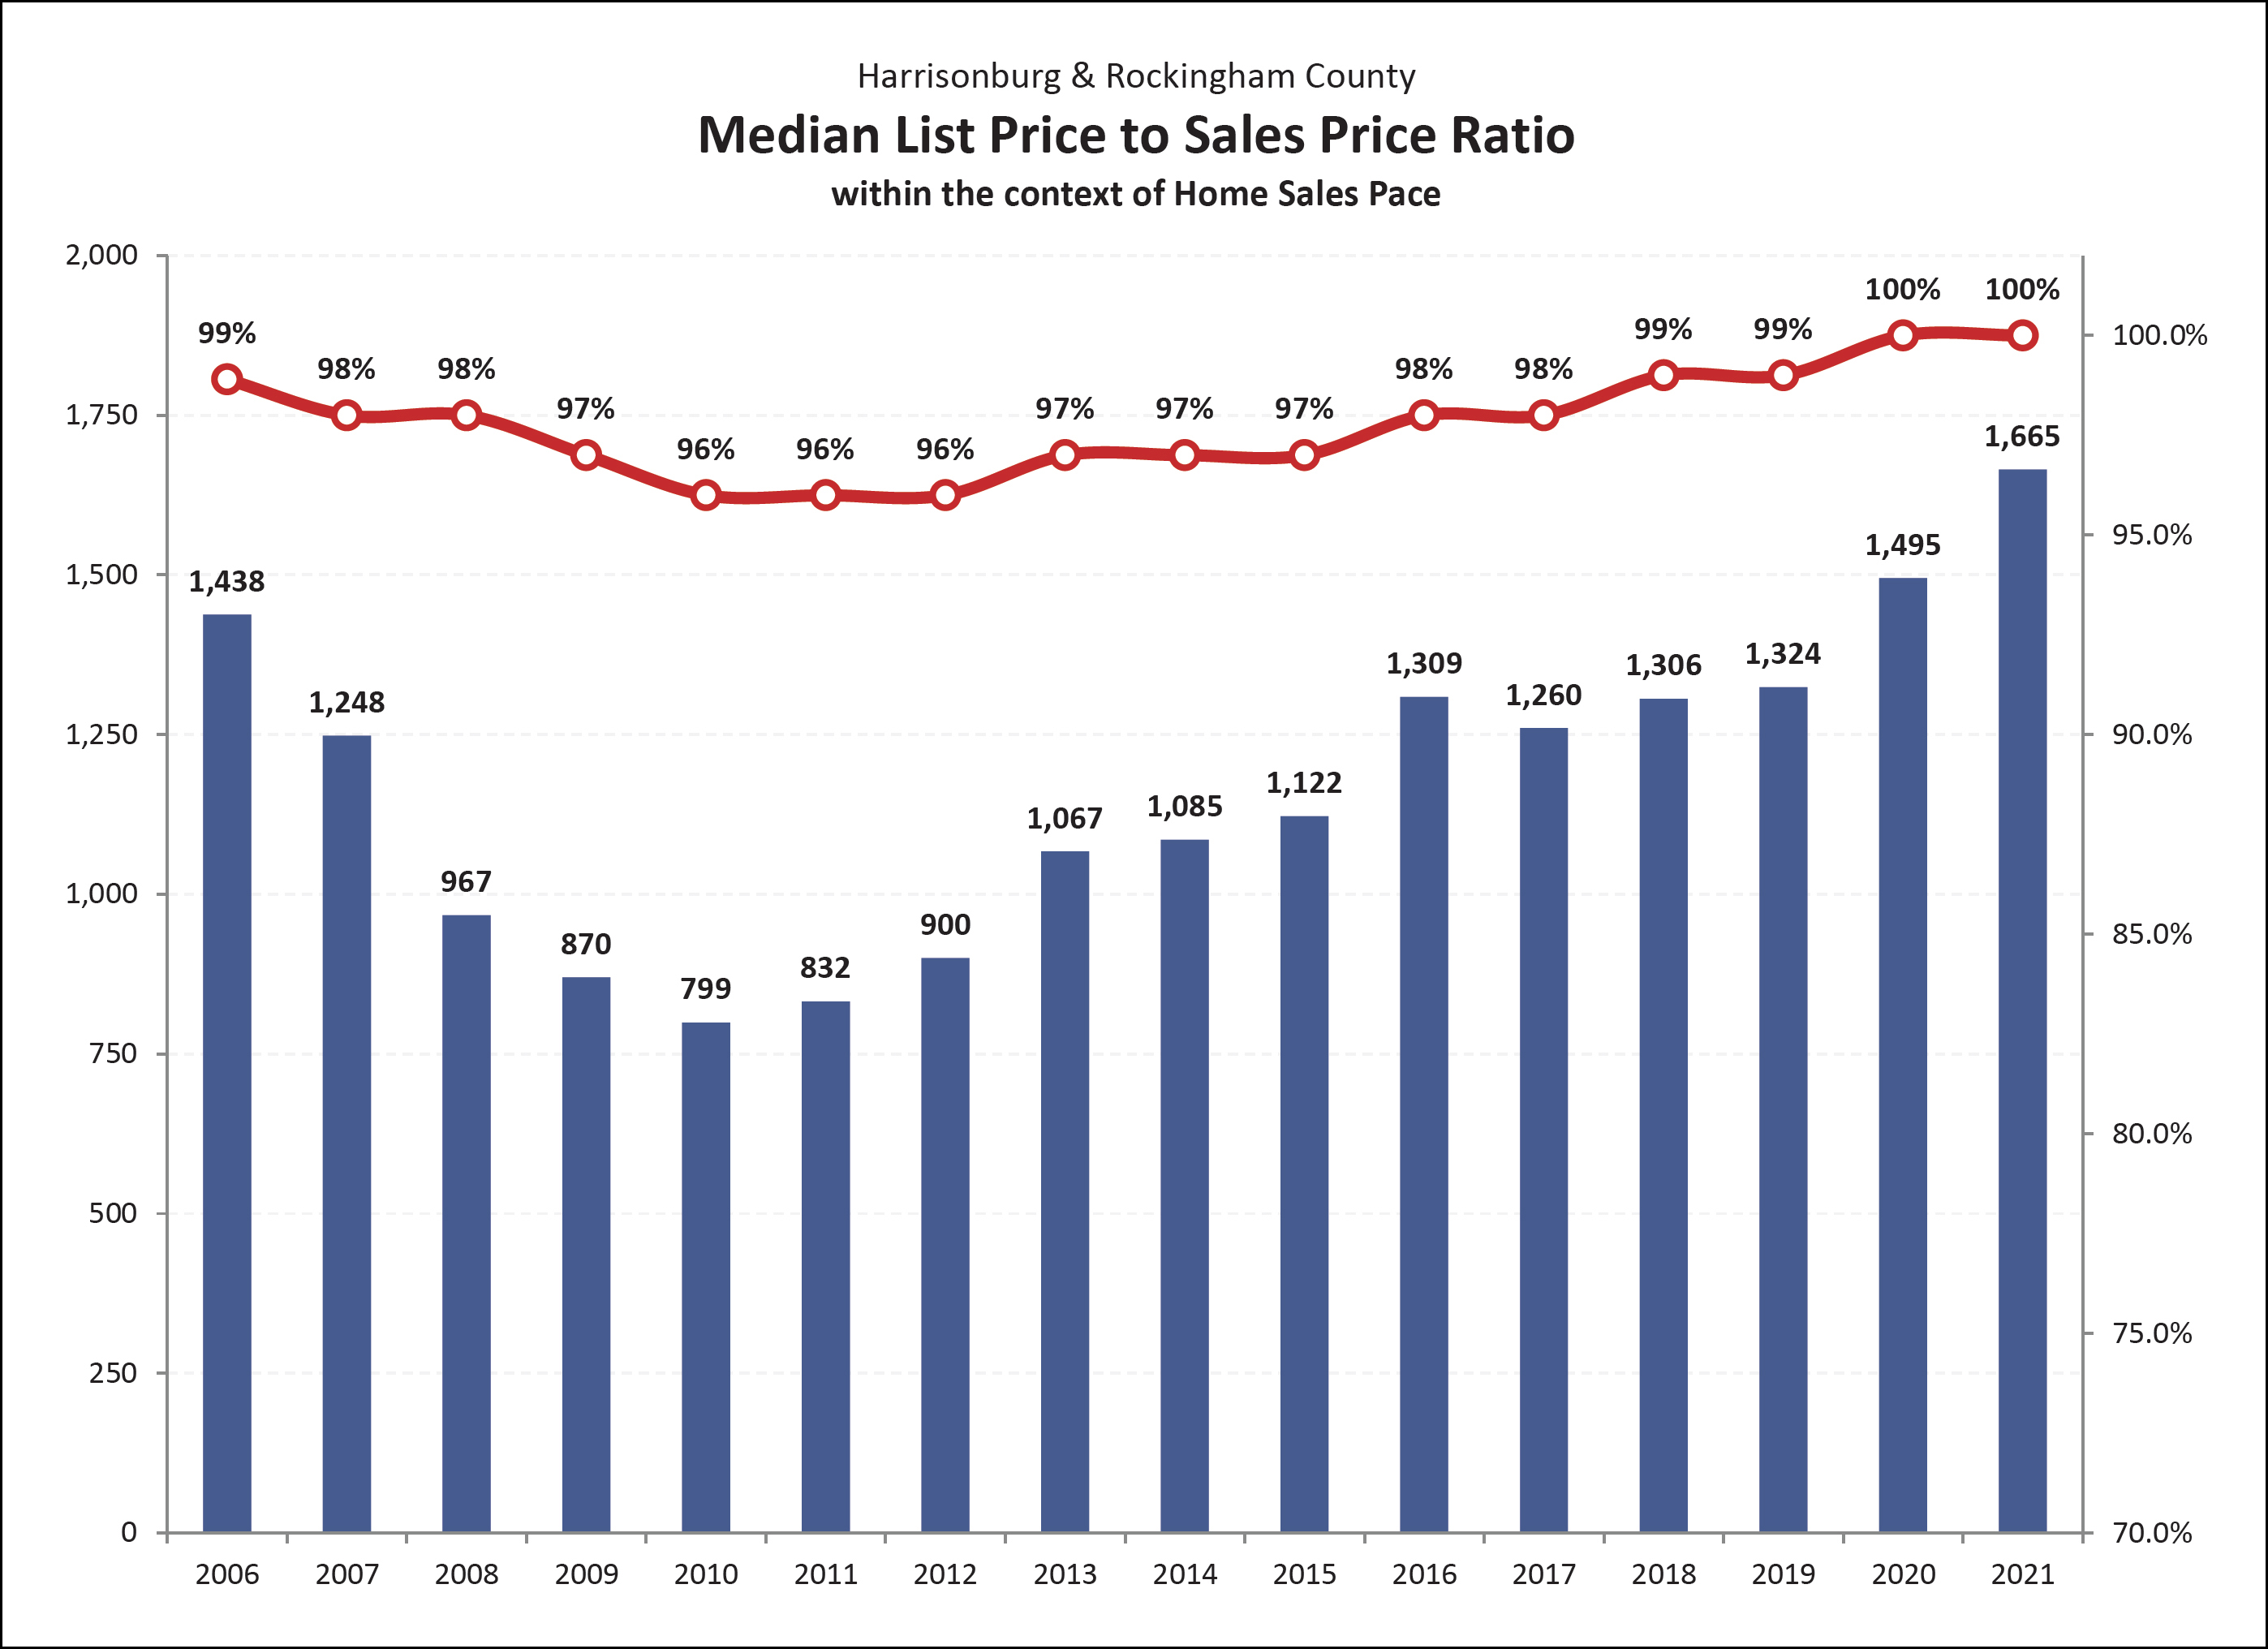
This graph shows the average list price to sales price ratio (red line) over the past 15 years as compared to the overall pace of home sales. At the peak of the housing boom (2004-2006) sellers were able to obtain a median of 99% of their asking price. Then, when the pace of home sales slowed (through 2010) this metric dropped to 96%, where it stayed for three years. Sellers started selling for slightly more in 2013-2015 when they could obtain 97% of their list price. This increased to 98% in 2016 (remained there in 2017), and was been holding at 99% since 2018, but popped up to a median of 100% in 2020 which held 2021.
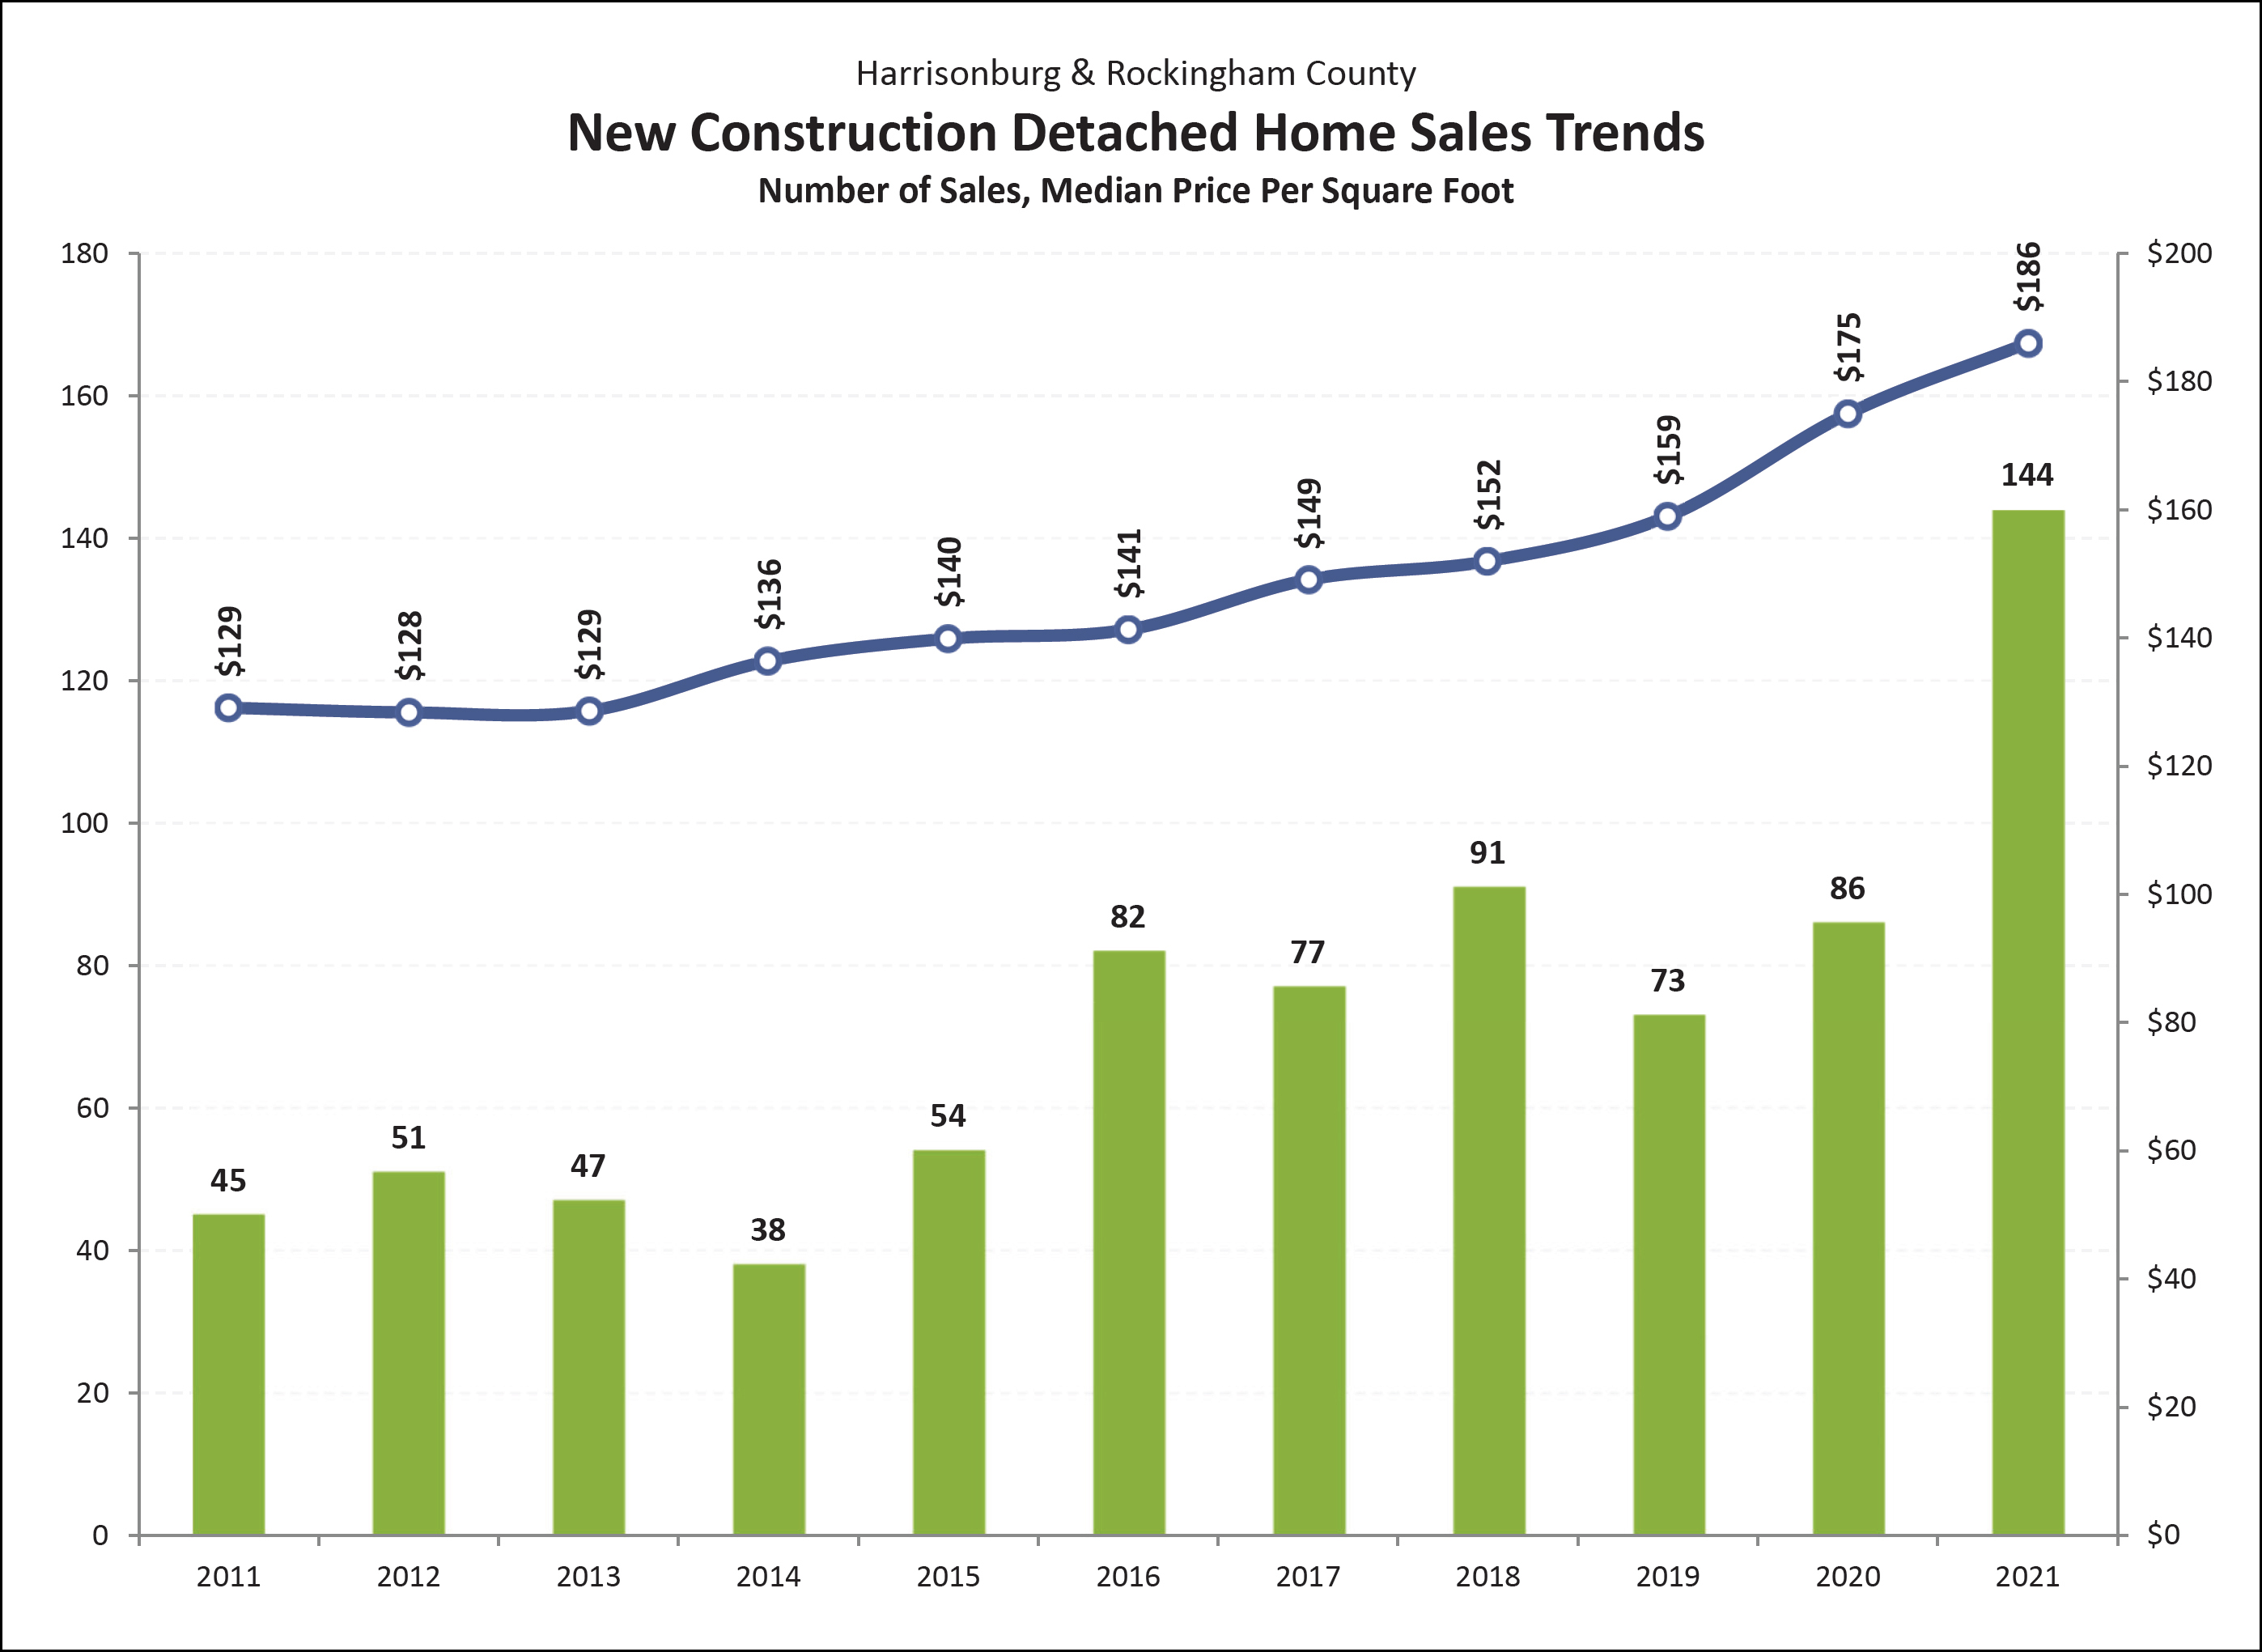
New home builders built a record number of new homes in Harrisonburg and Rockingham County -- 144 -- approaching twice the number built per year in many of the past five to ten years. These figures, of course, only represent new homes being marketed through the MLS. Plenty of additional new homes are built by local home builders on lots already owned by the person who will live in the home - and thus they do not show up in the MLS. These new home sales show a steady increase in the price per square foot of homes being built and sold over the past ten years, with the largest increase in that value taking place in 2020.
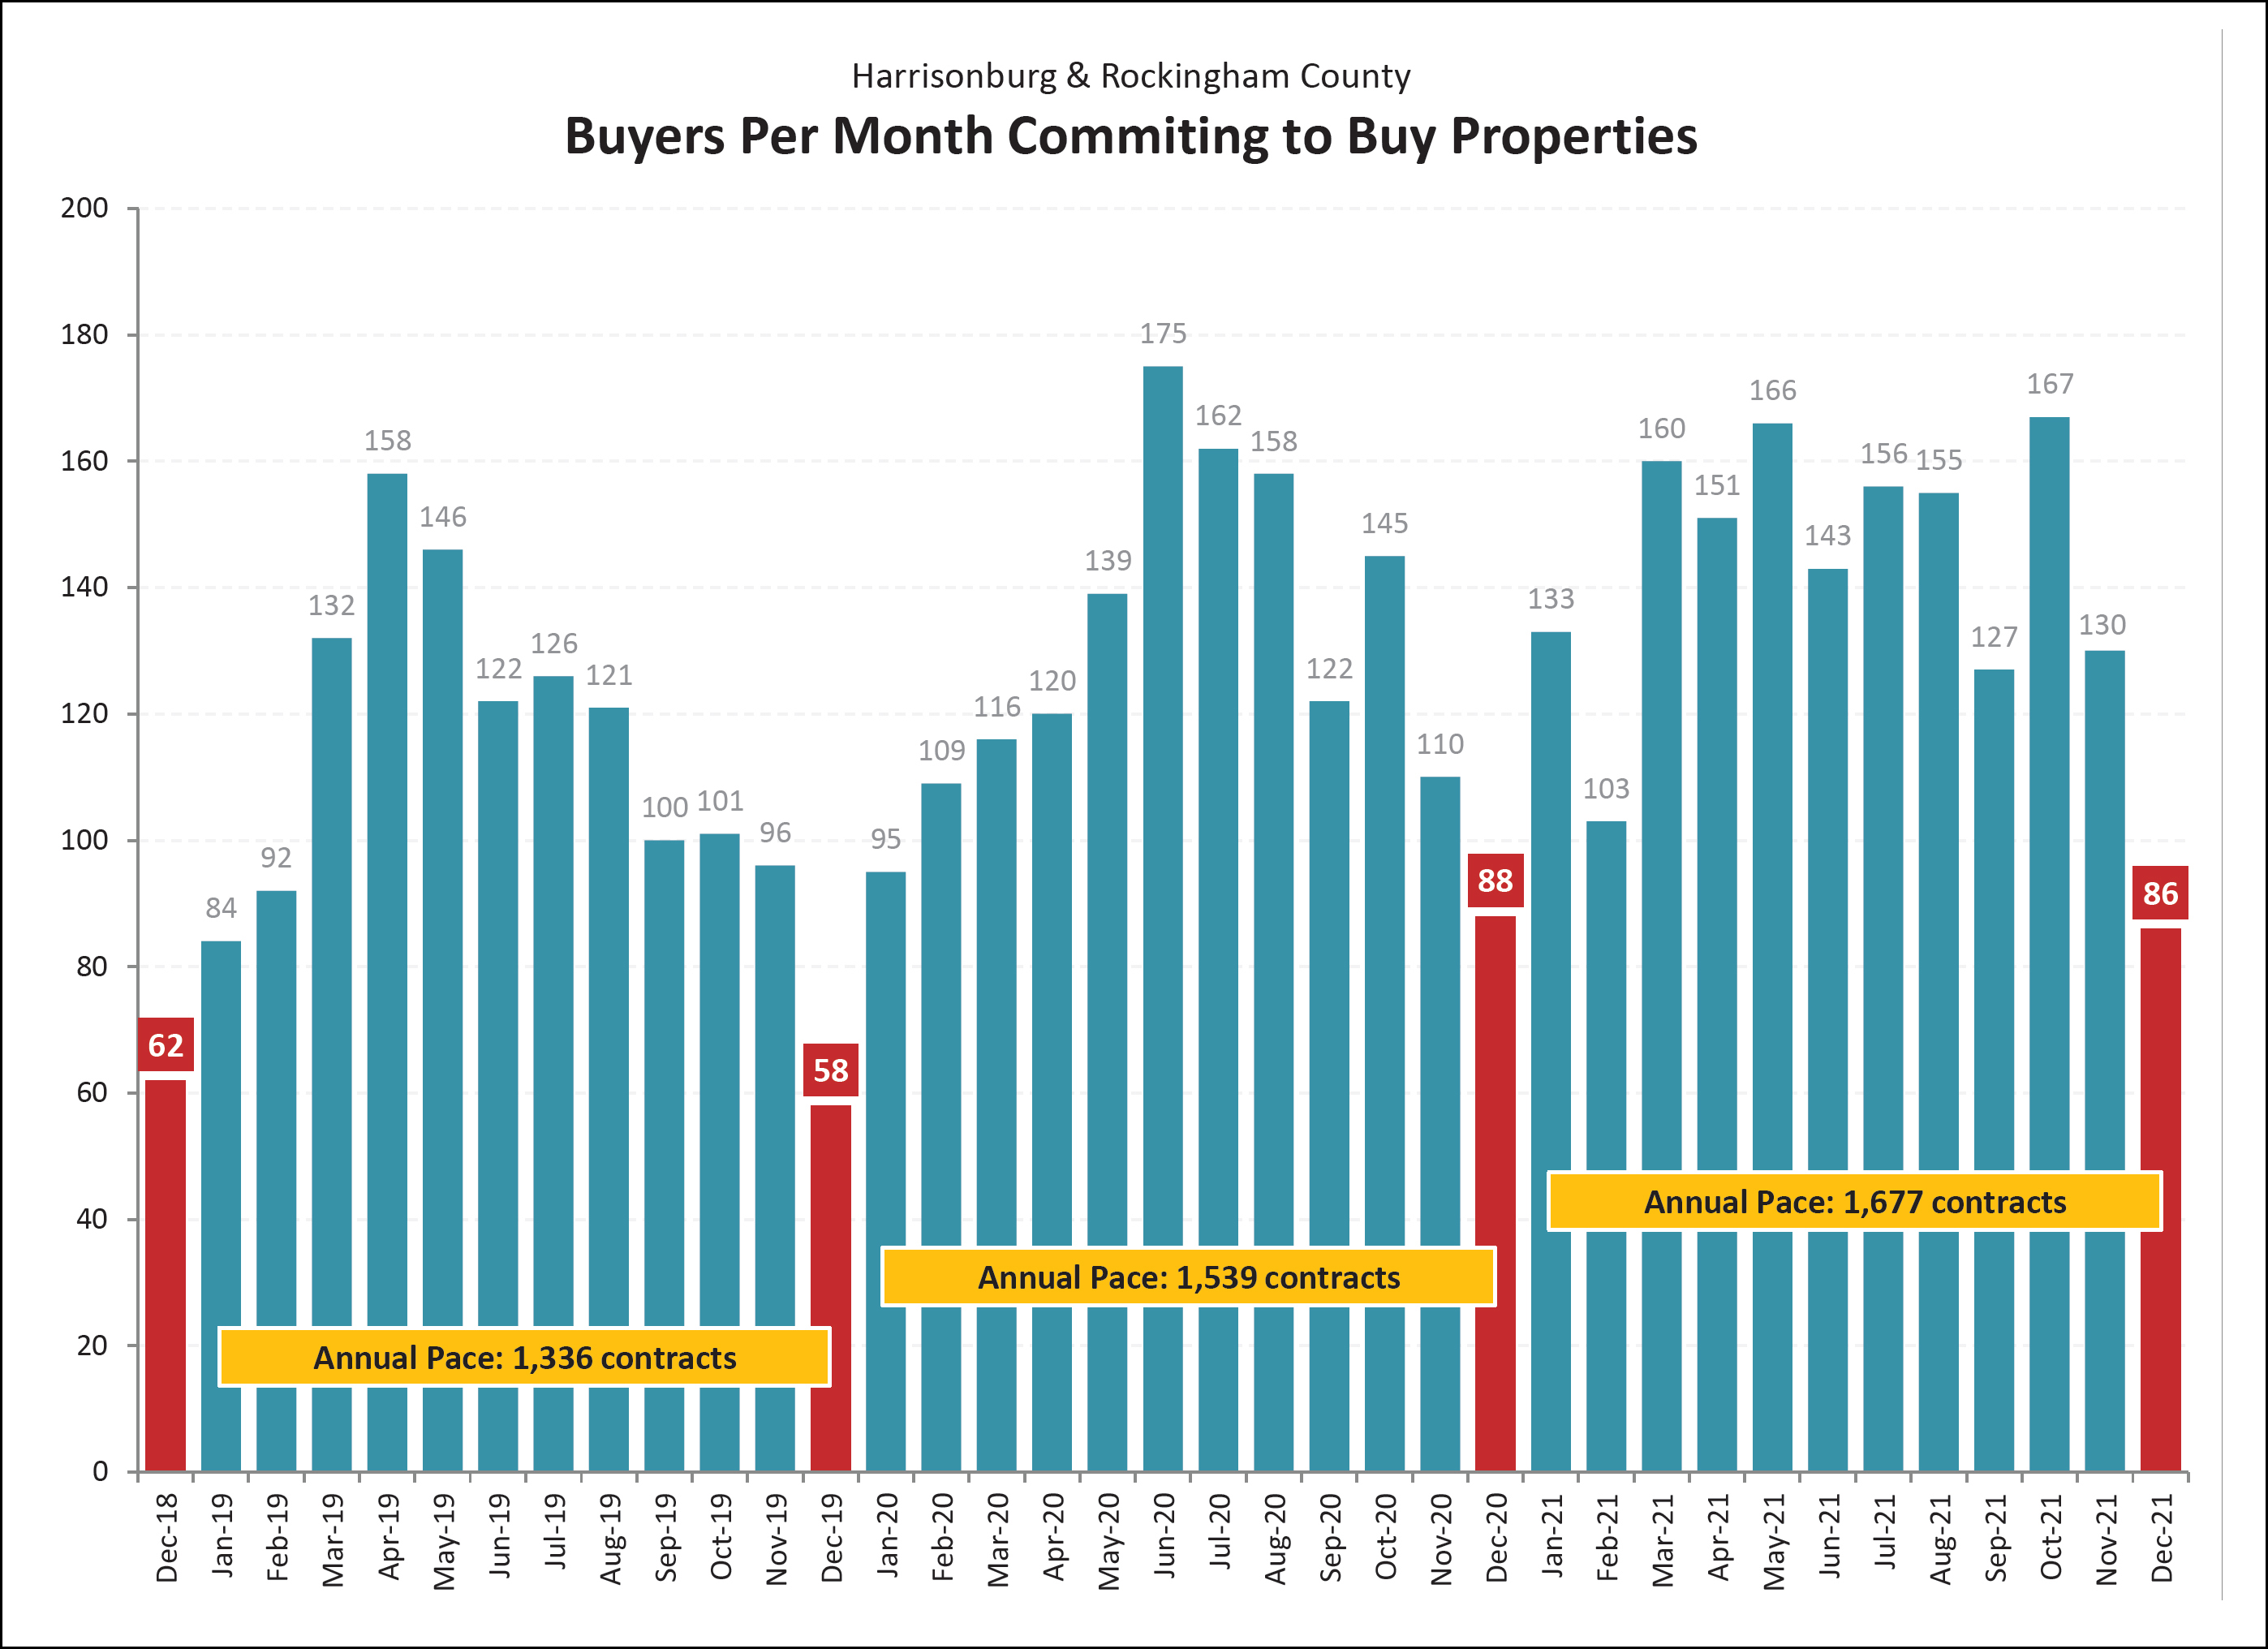
As expected, we saw a significant drop in contract activity in December 2021. This is typical for December as there are usually fewer homes on the market and fewer buyers ready to buy homes during December with many holiday and end of year activities. All in all, the past year of contract activity has been dramatically higher than the same timeframe the prior year, leading to a strong year of sales in 2021. Looking ahead, we are likely to see contract activity start to increase steadily as we move through the next few months. Last year, January contract activity was actually higher than February and September!
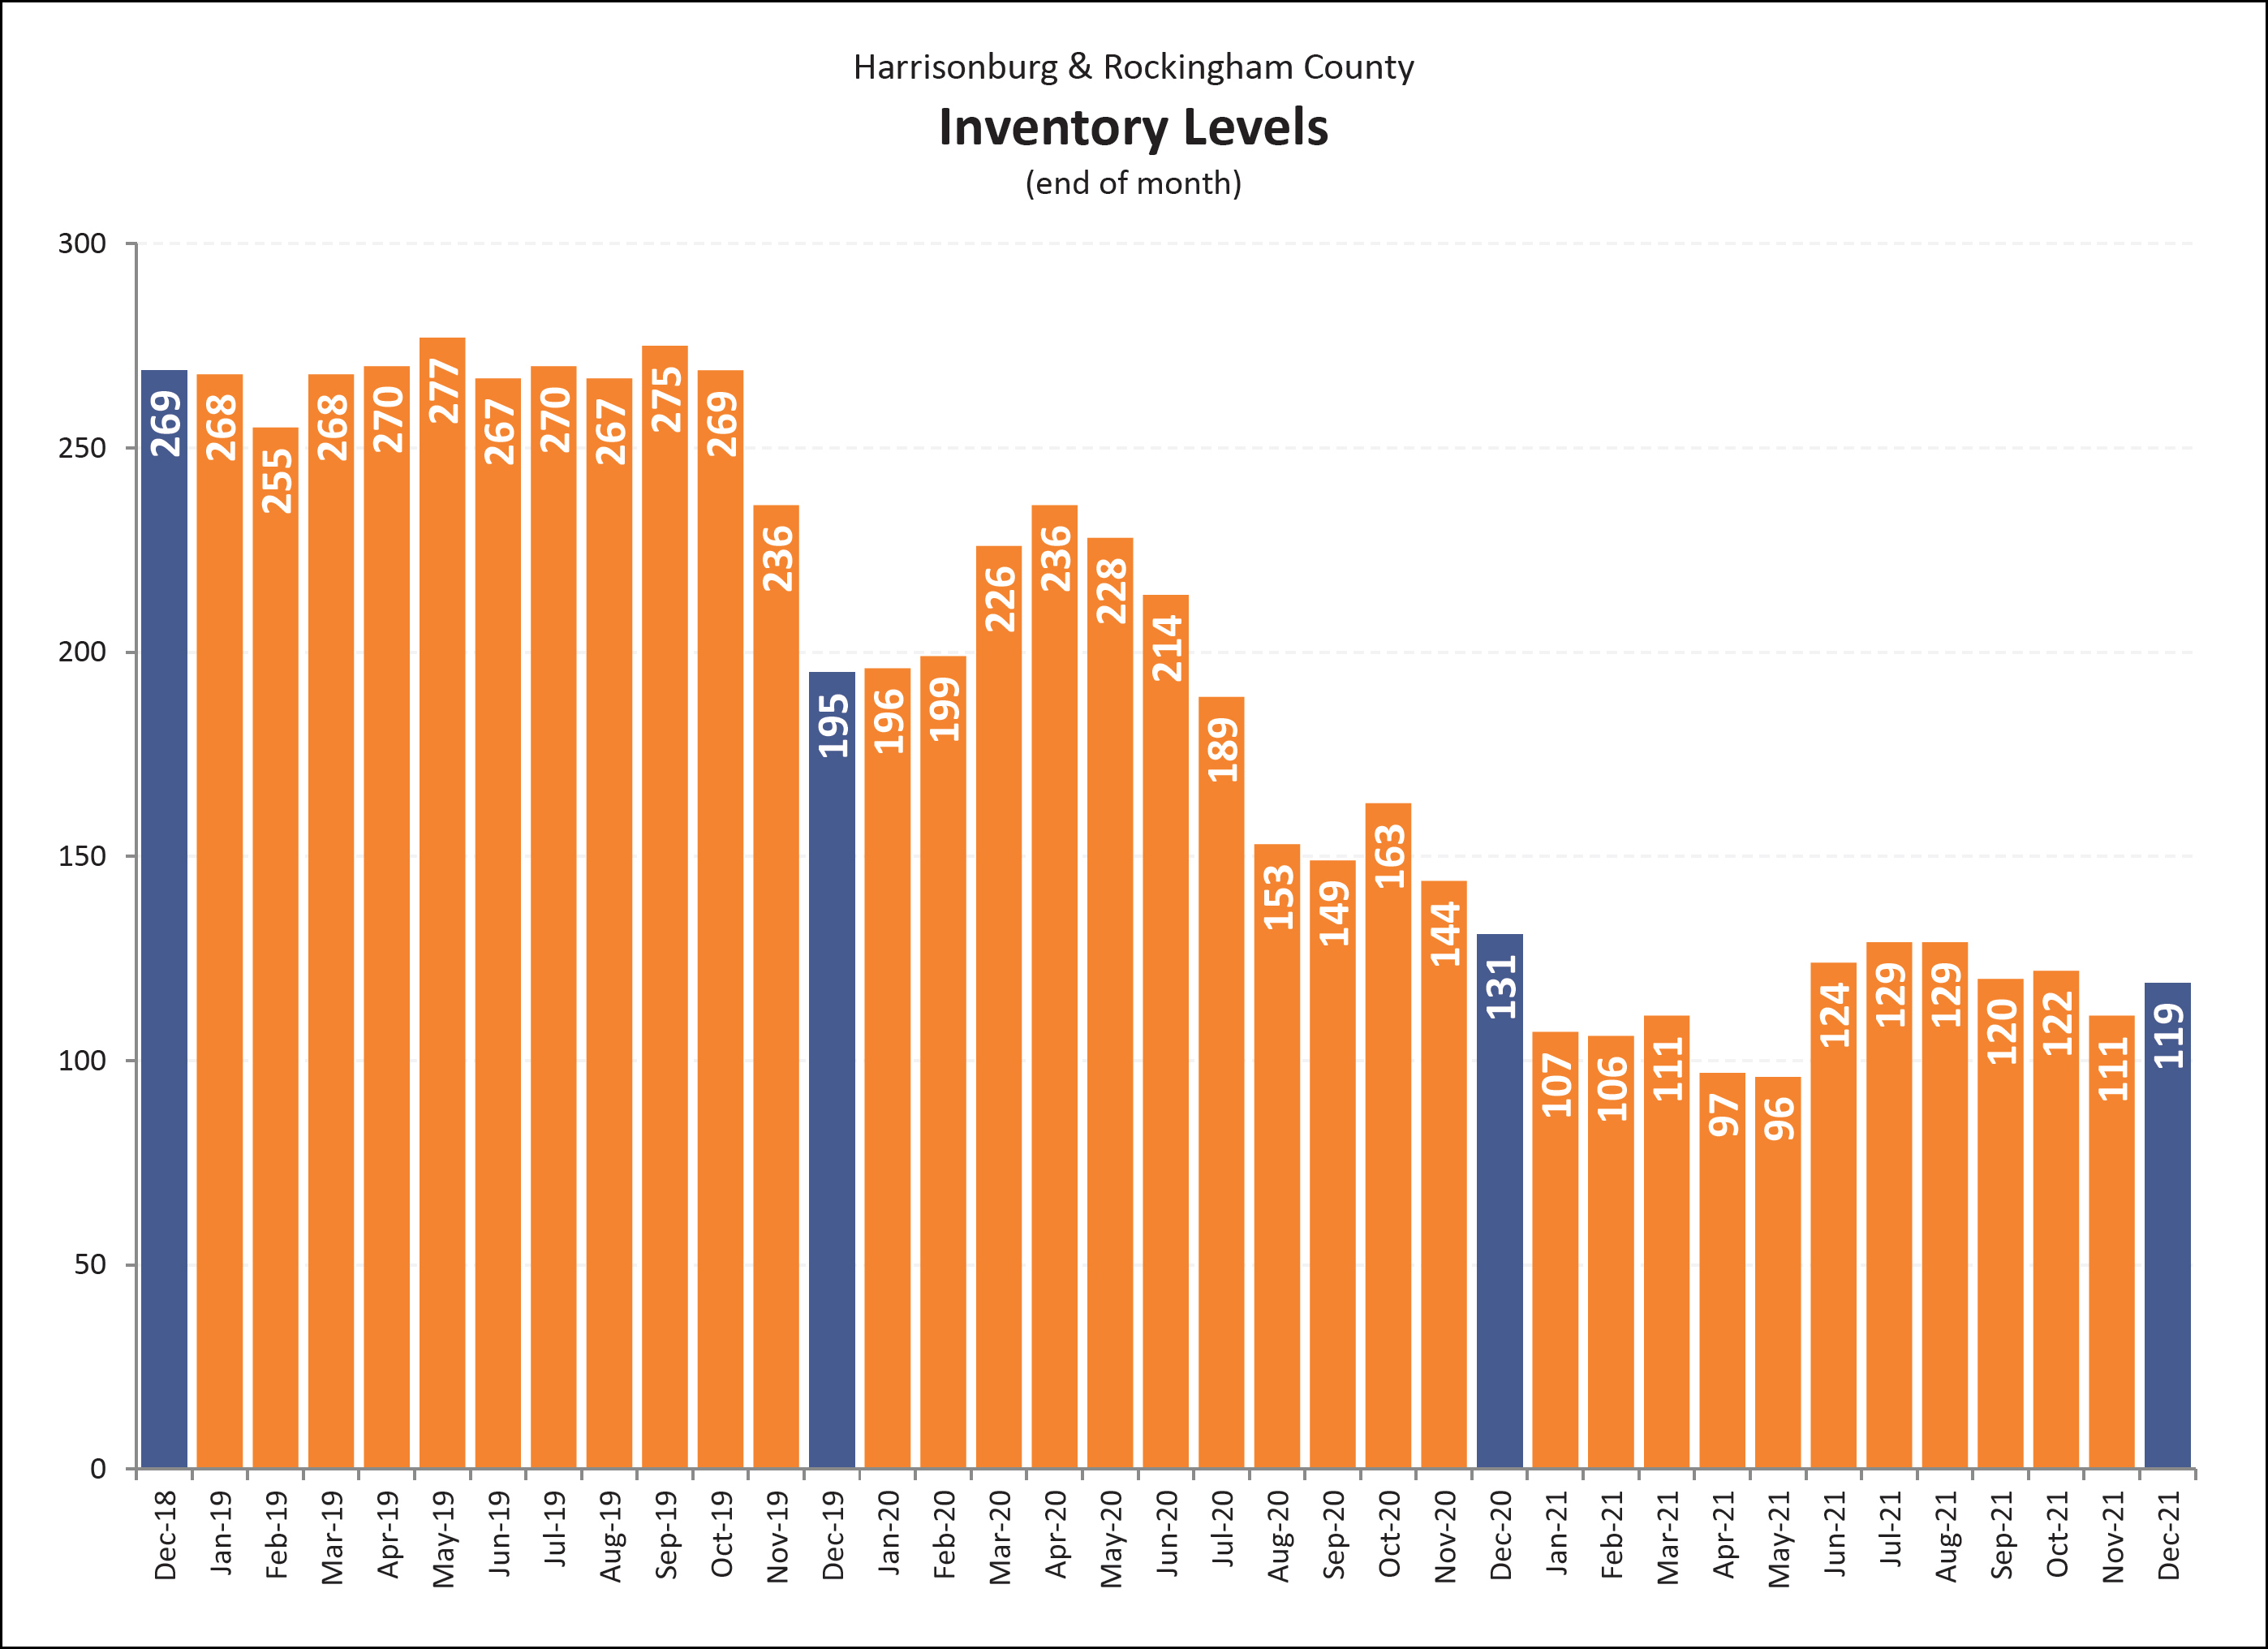
Over the past several years, inventory levels have dipped lower and lower and lower. This has not, though, been accompanied by a decline in the pace of home sales. So -- if just as many (or more) buyers are buying, how are they doing it if inventory levels are so low? They’re doing it with speed. The pace of home sales can increase, with inventory levels declining if the median “days on market” is also declining, which is definitely the case in our local market. So, plenty (maybe, maybe not) homes are being listed for sale, but they are then going under contract quickly, which keeps inventory levels low but the pace of home sales high.
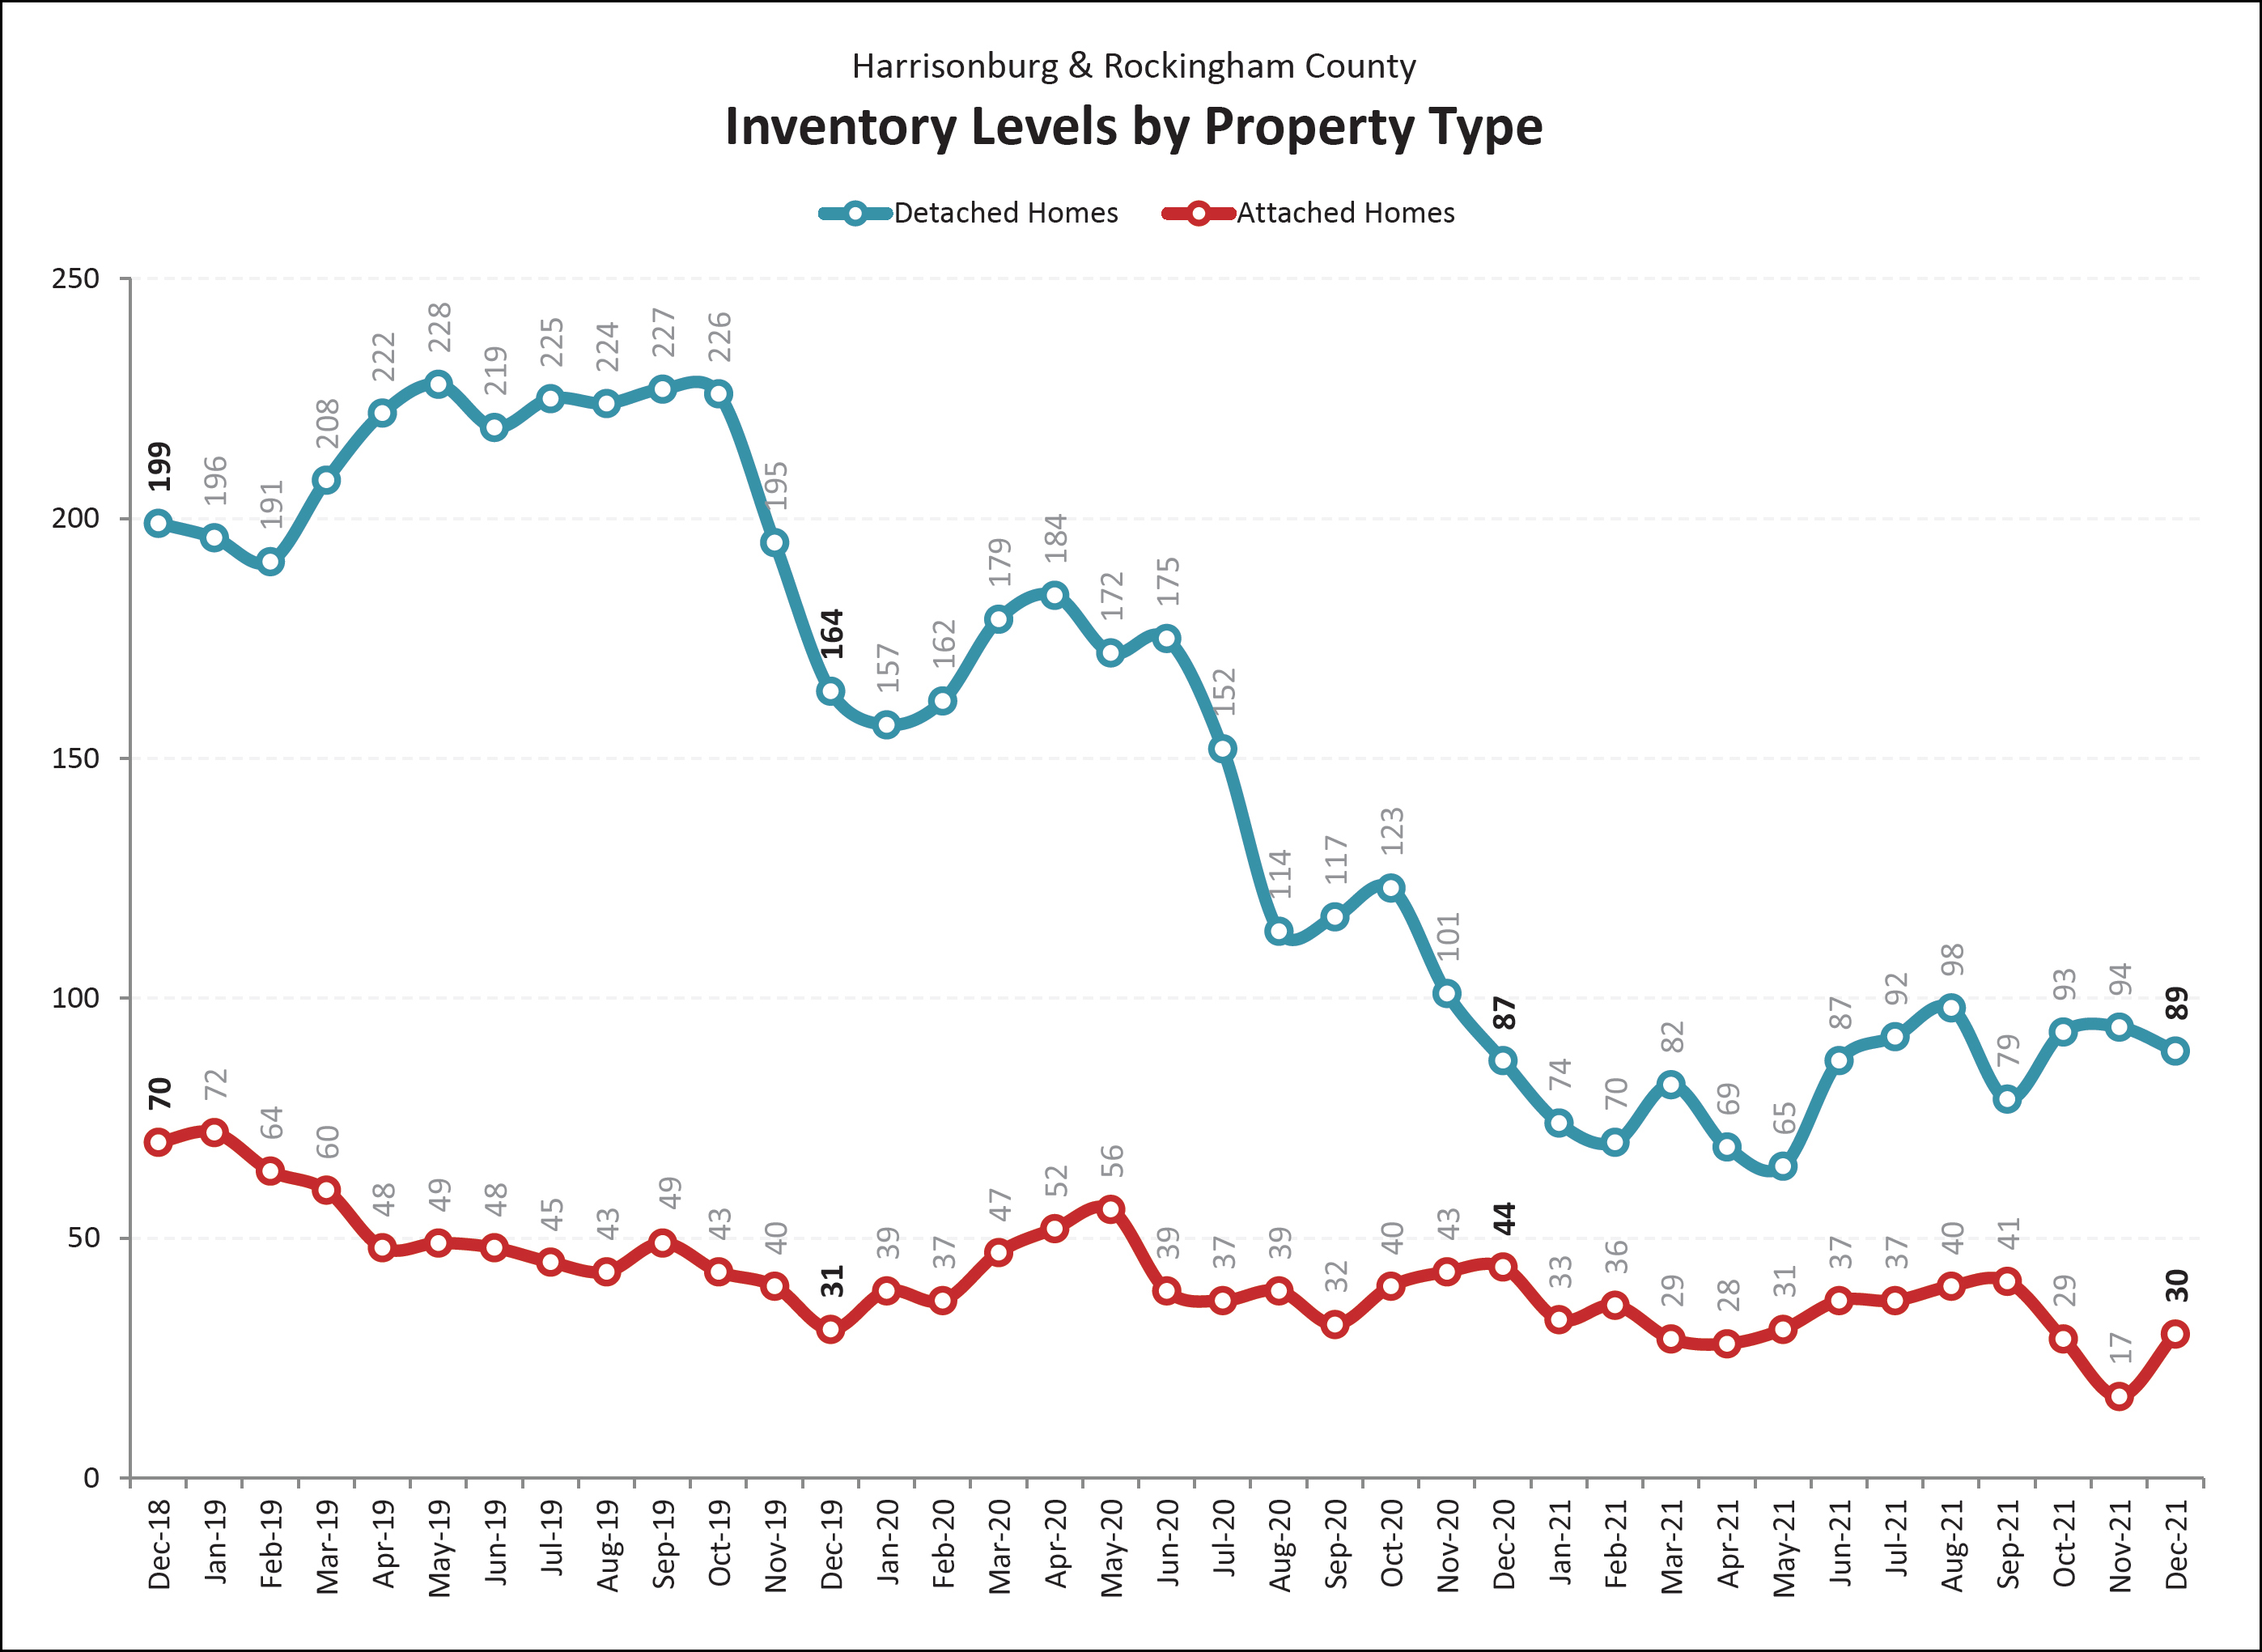
This graph examines the differences in inventory levels over time when examining only single family homes as compared to attached dwellings (townhouses, duplexes, condos). The number of detached homes for sale has declined steadily over the past two years with a 46% drop while number of attached homes (townhouses, duplexes and condos) for sale has remained relatively steady (and remarkably low) over the past two years. Normal seasonal changes in inventory levels (more homes on the market in the spring) do not seem to be holding true at this point.
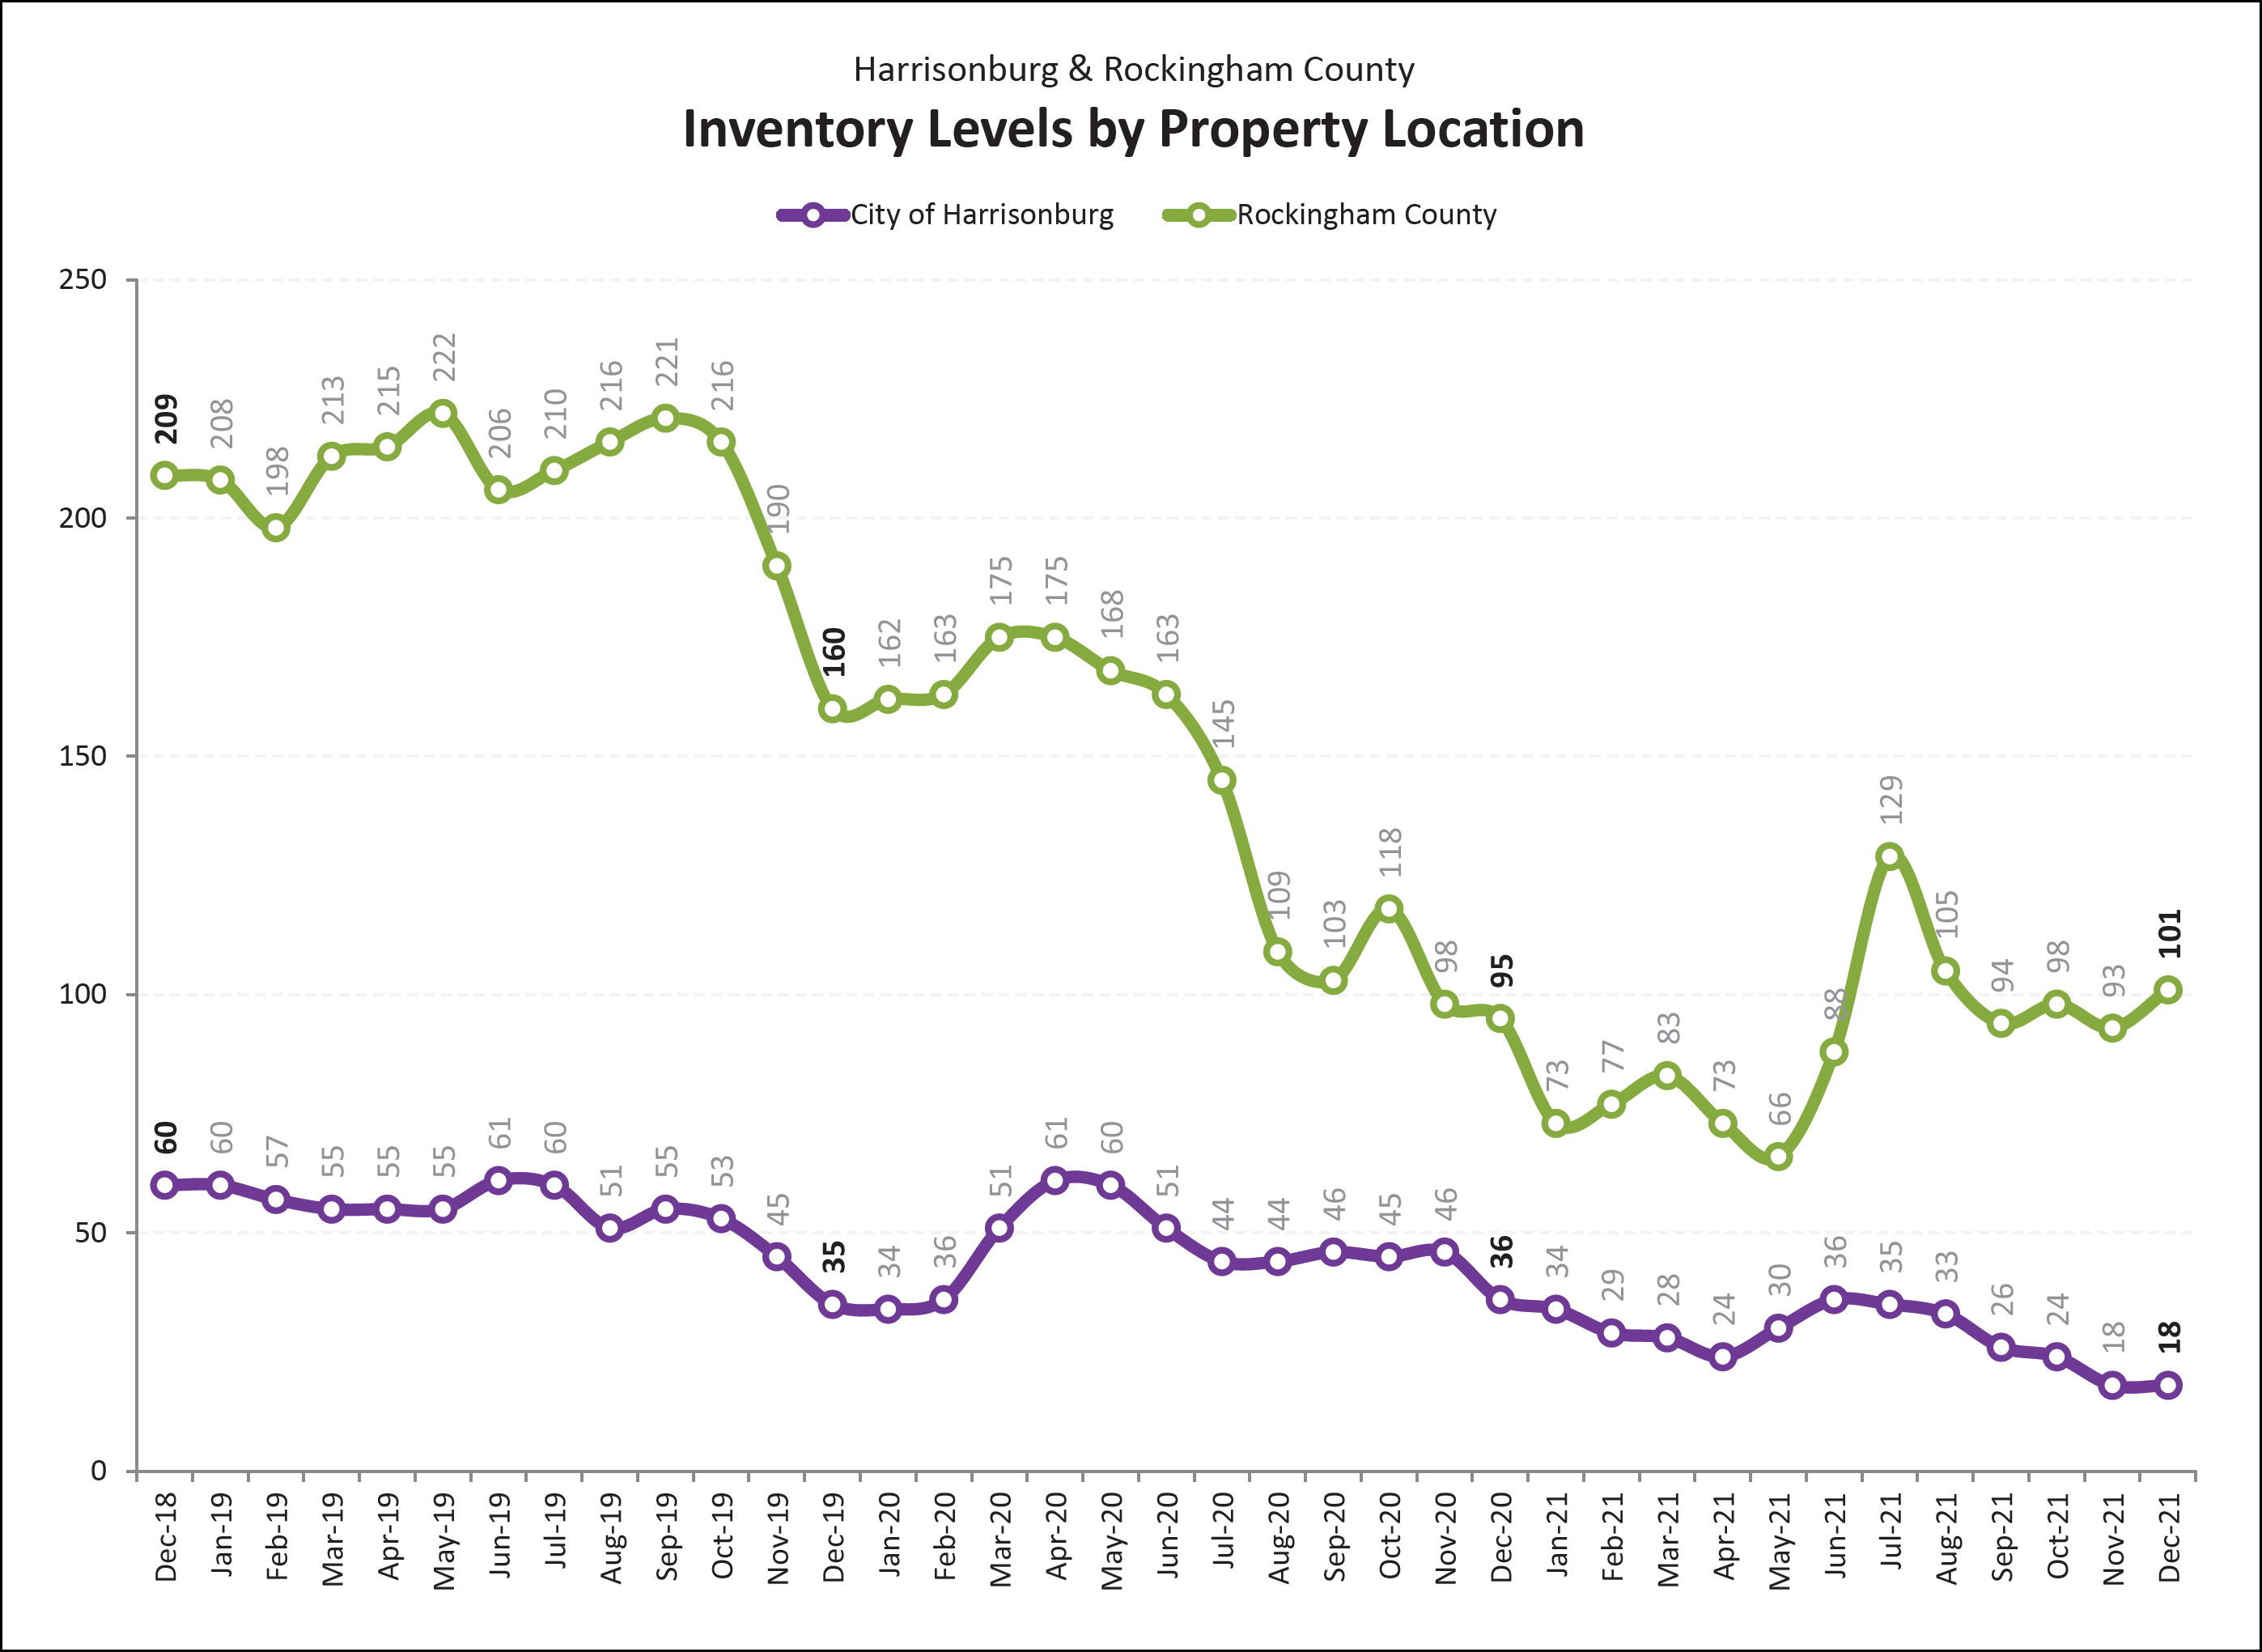
Inventory levels have stayed relatively level (95 to 101) in Rockingham County over the past year given an increase in listing inventory over the past few months -- while City inventory levels have fallen 50% during the same timeframe. Of note -- there are currently more than five times as many home sales in the County as compared to the City. Low inventory levels are much more of an issue in the City right now if we look at both sellers (supply) and buyers (demand). This is likely leading to the faster increases in median sales price in the City, and the lower median days on market in the City as compared to the same metrics in the County.
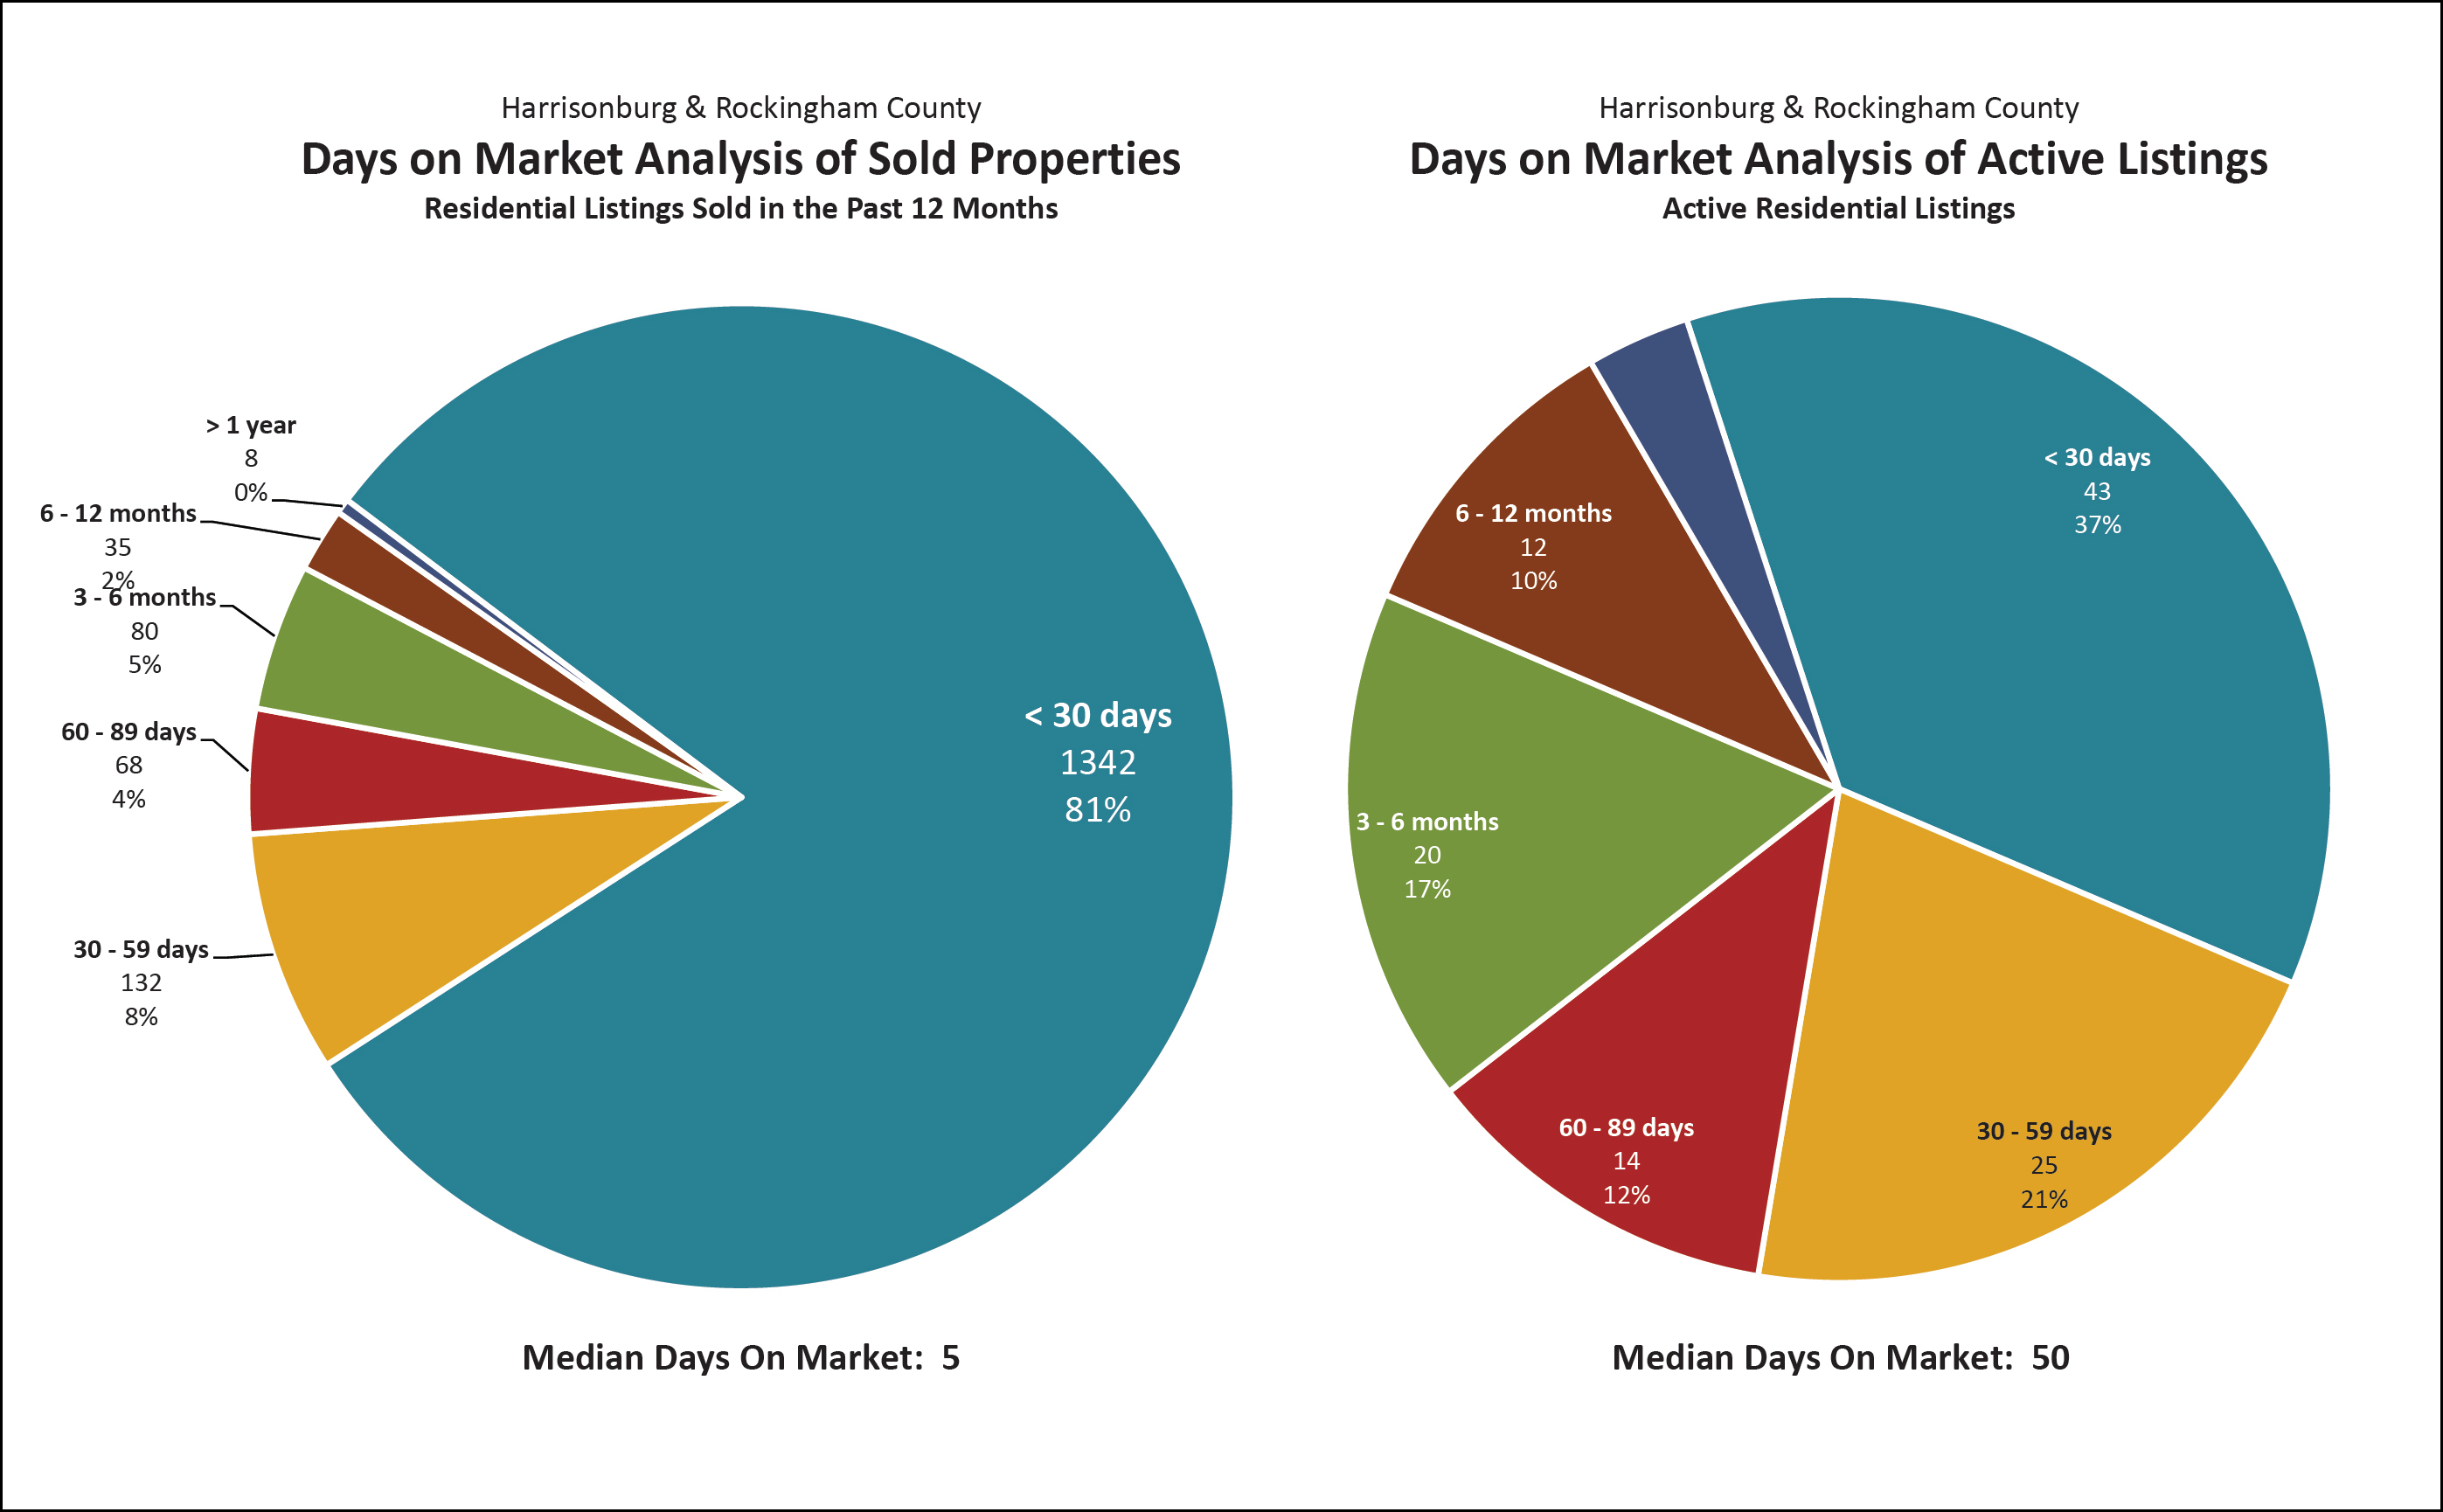
Declining inventory levels are contributing to an overall decline in the time it takes to sell a home in Harrisonburg and Rockingham County. The current median “Days on Market” is 5 days for homes that have sold in the past year. Remarkably, 81% of homes that have sold in the past year have gone under contract within 30 days of having hit the market. Combine that with those that went under contract during the second month on the market, and you’ll find that 89% of homes that sell go under contract within 60 days. The graph to the right, above, shows the length of time that each active listing has been on the market for sale.
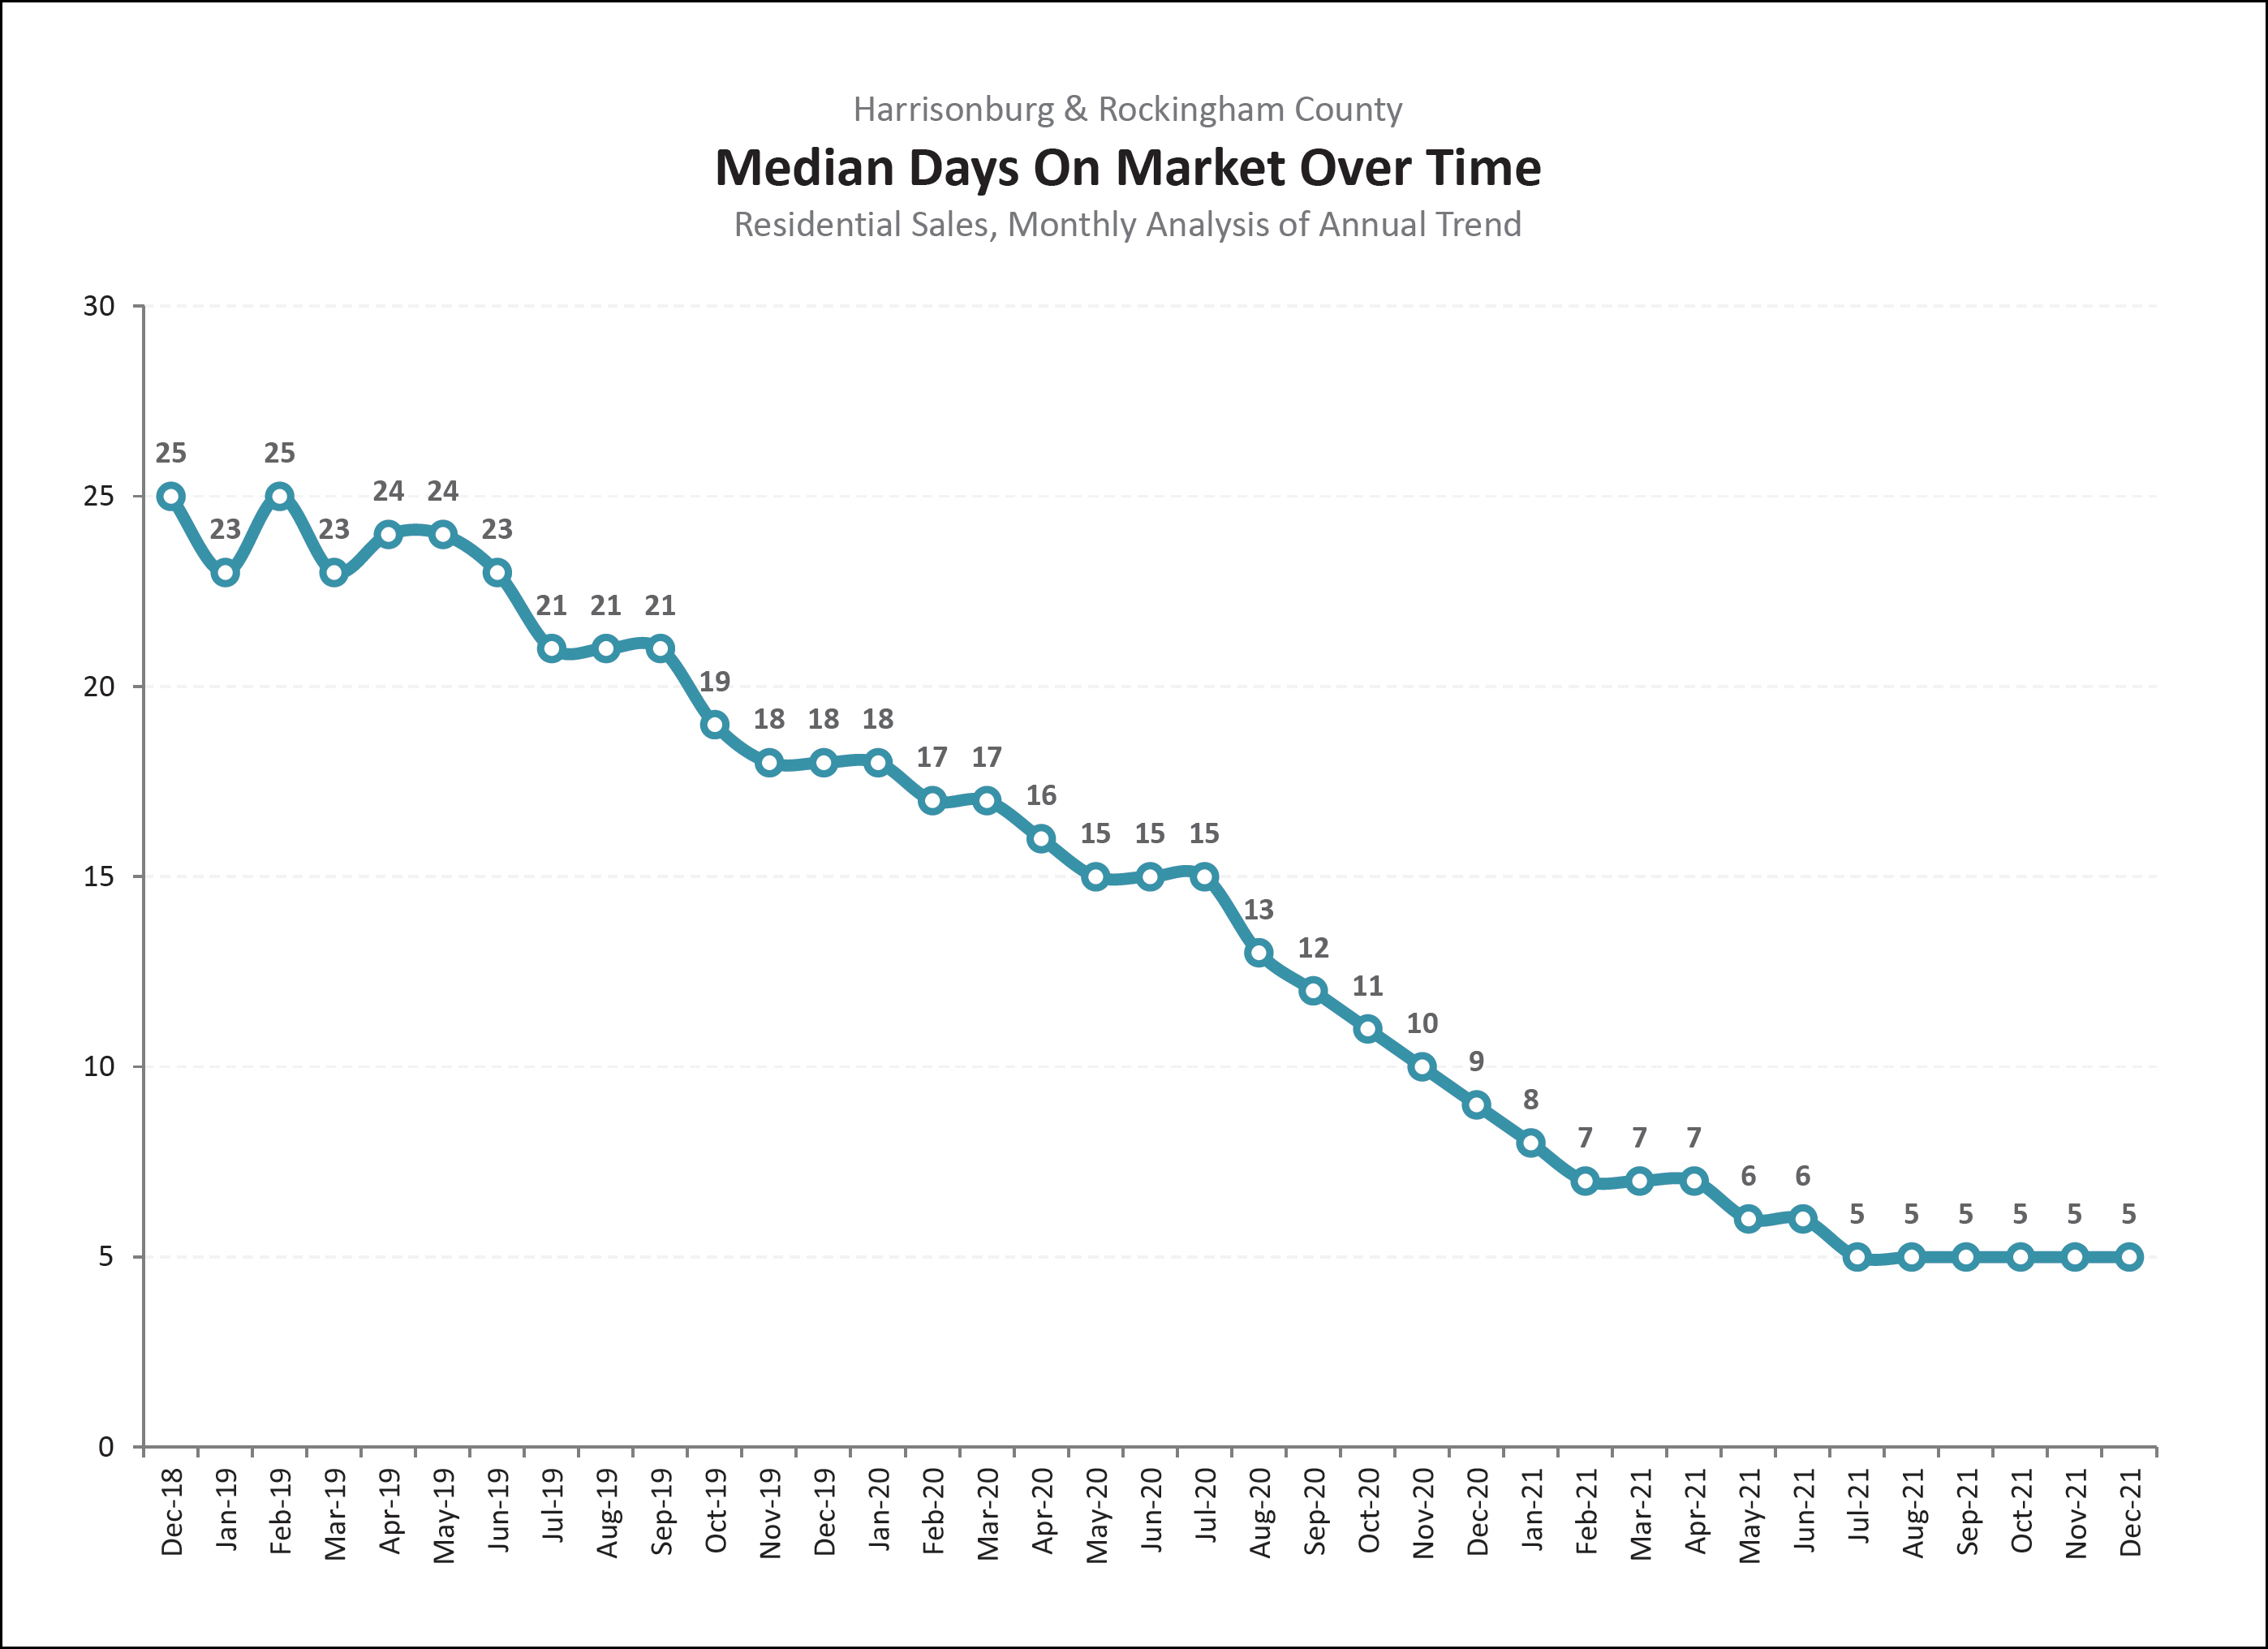
Days on market -- how quickly homes are going under contract -- can be an excellent indication of the mood of the local housing market. Independent of how many homes are selling and the prices at which they are selling -- if they are going under contract quickly then the market is strong and power is tipped towards sellers -- and if homes are taking a longer time to go under contract the market is not quite as strong and power is starting to balance out between sellers and buyers. Over the past three years we have seen a steady decline in how long it takes homes to go under contract, with a current median of five days on the market.
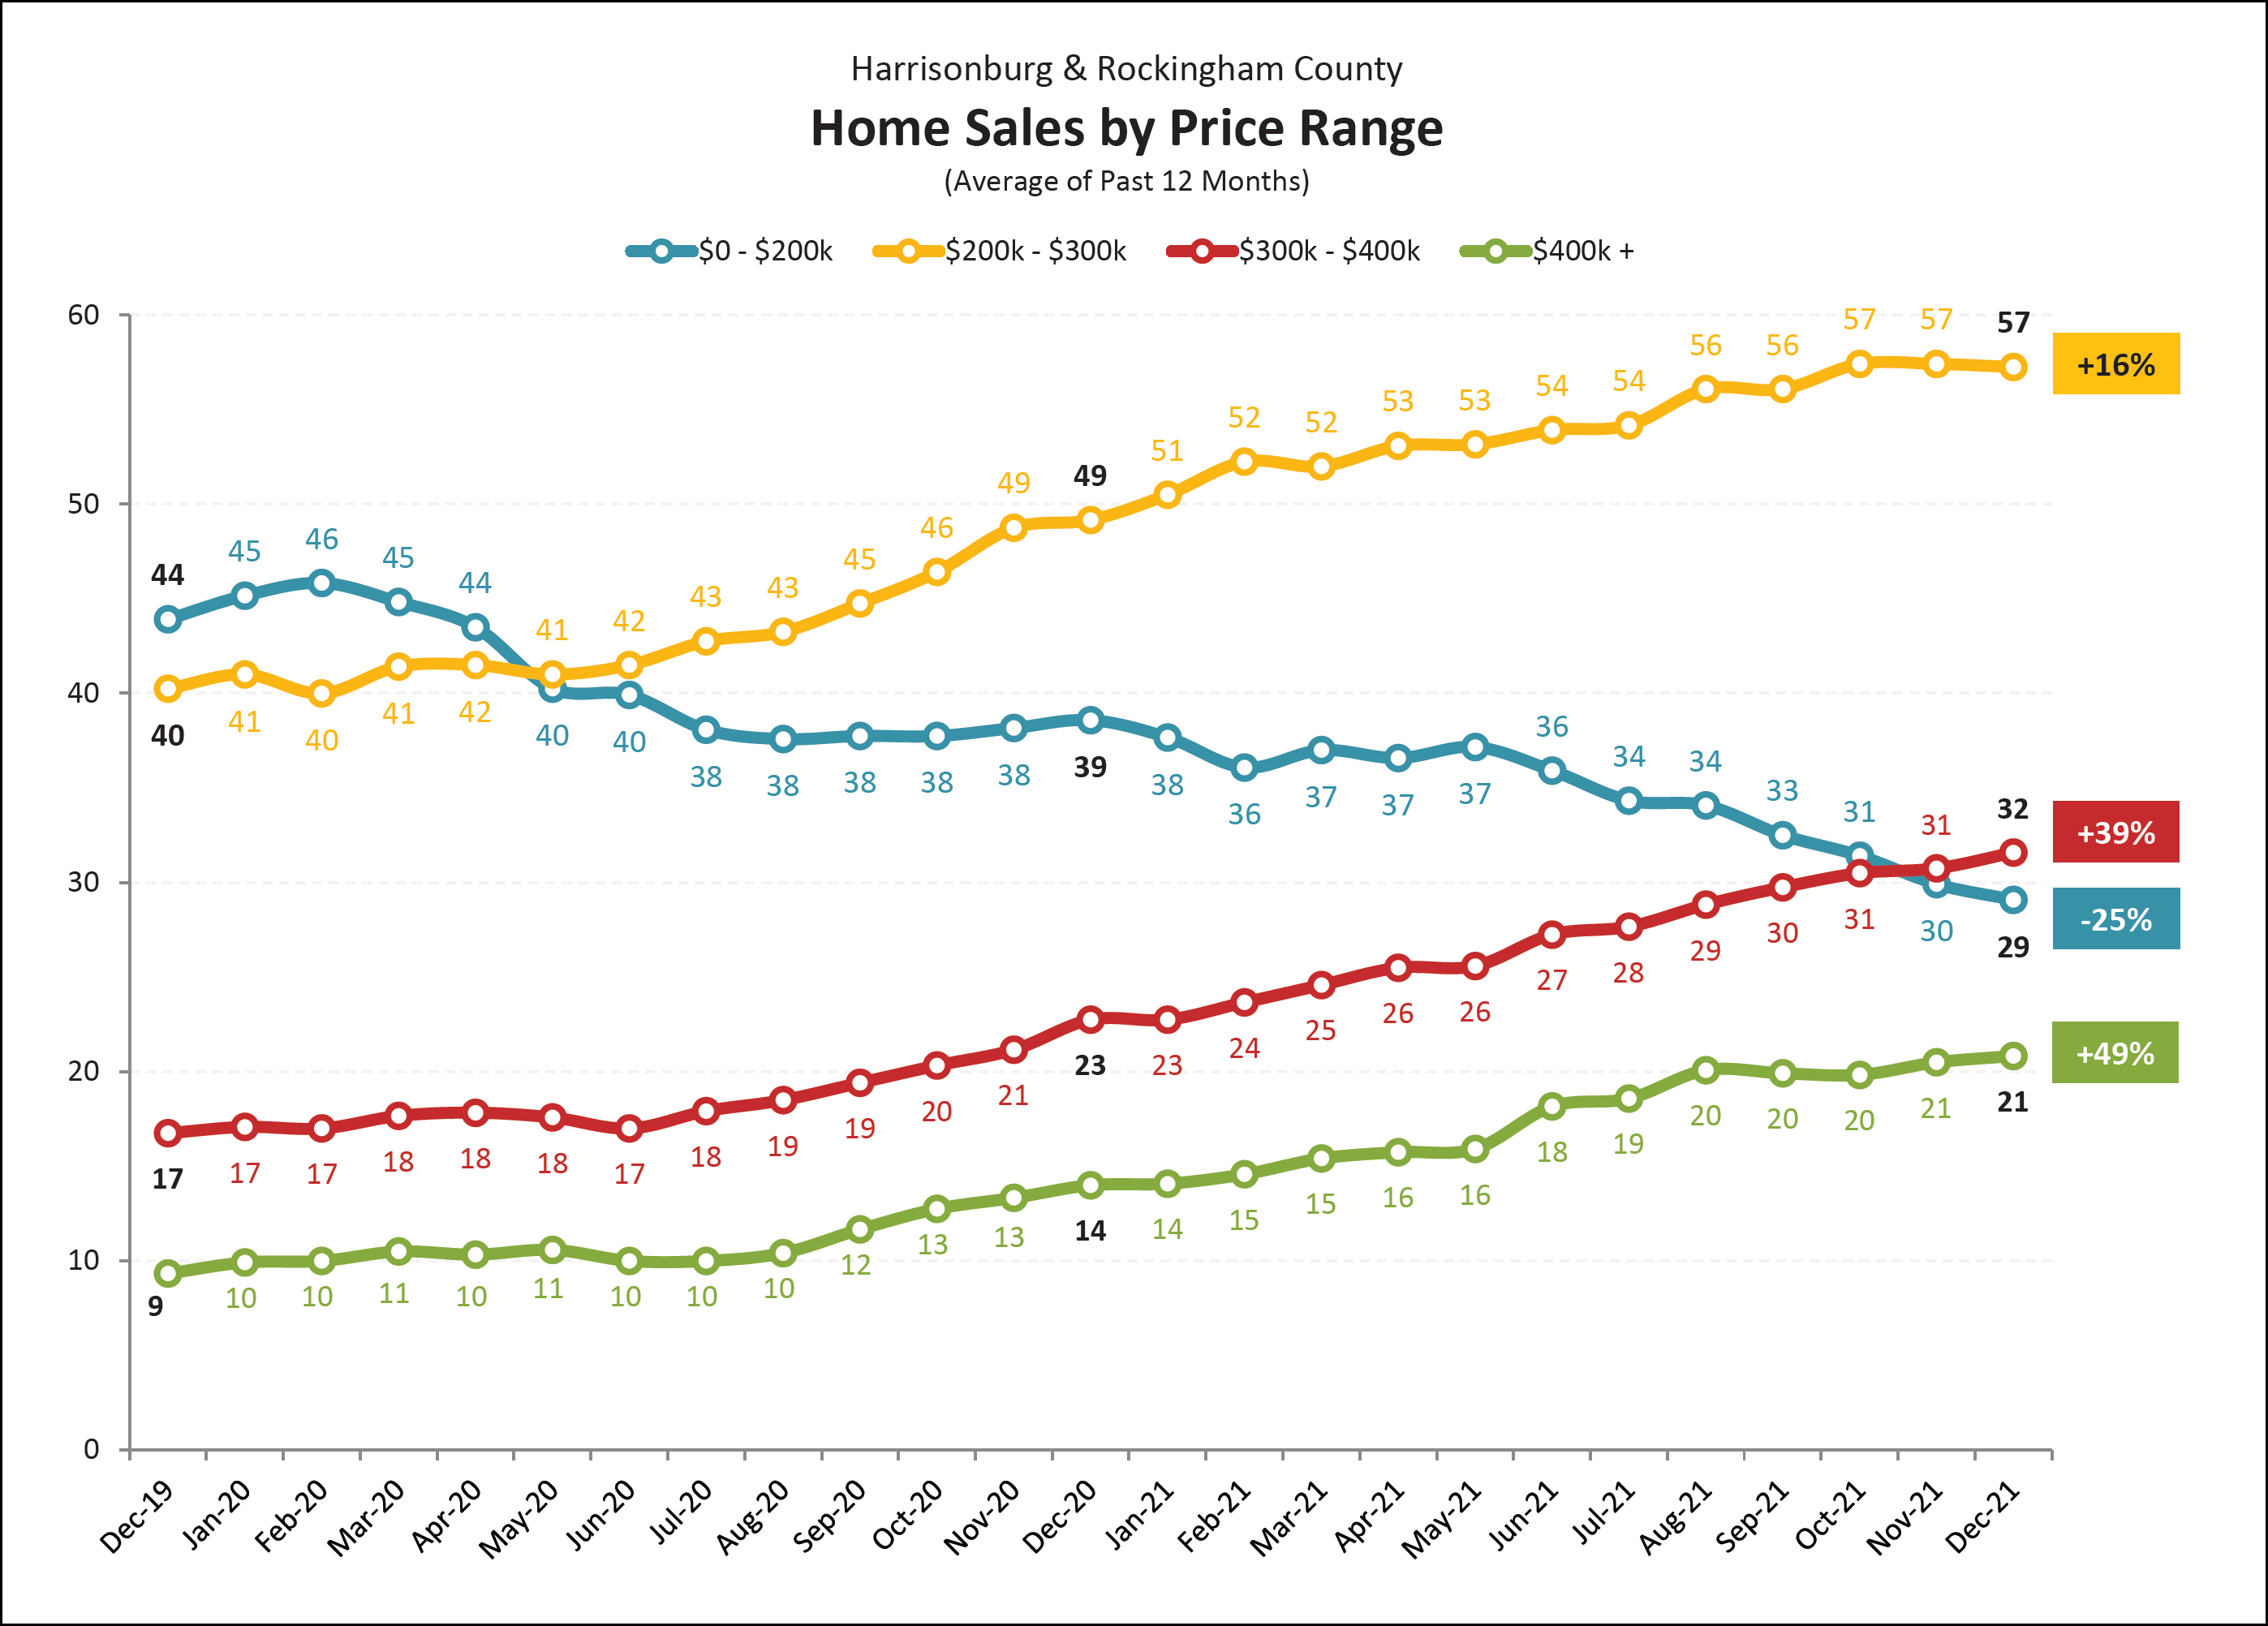
The pace of home sales in Harrisonburg and Rockingham County varies significantly based on price range. The graph above shows the average number of home sales per month (given a 12-month average) as we have passed through the past two years. Home sales have been declining over the past several years in the “under $200K” category -- though likely because of limited inventory, and fewer properties existing in this range based on increasing home values. We have seen year-over-year increases in all three of the other price ranges ($200K-$300K, $300K-$400K, $400K+) over the past year.
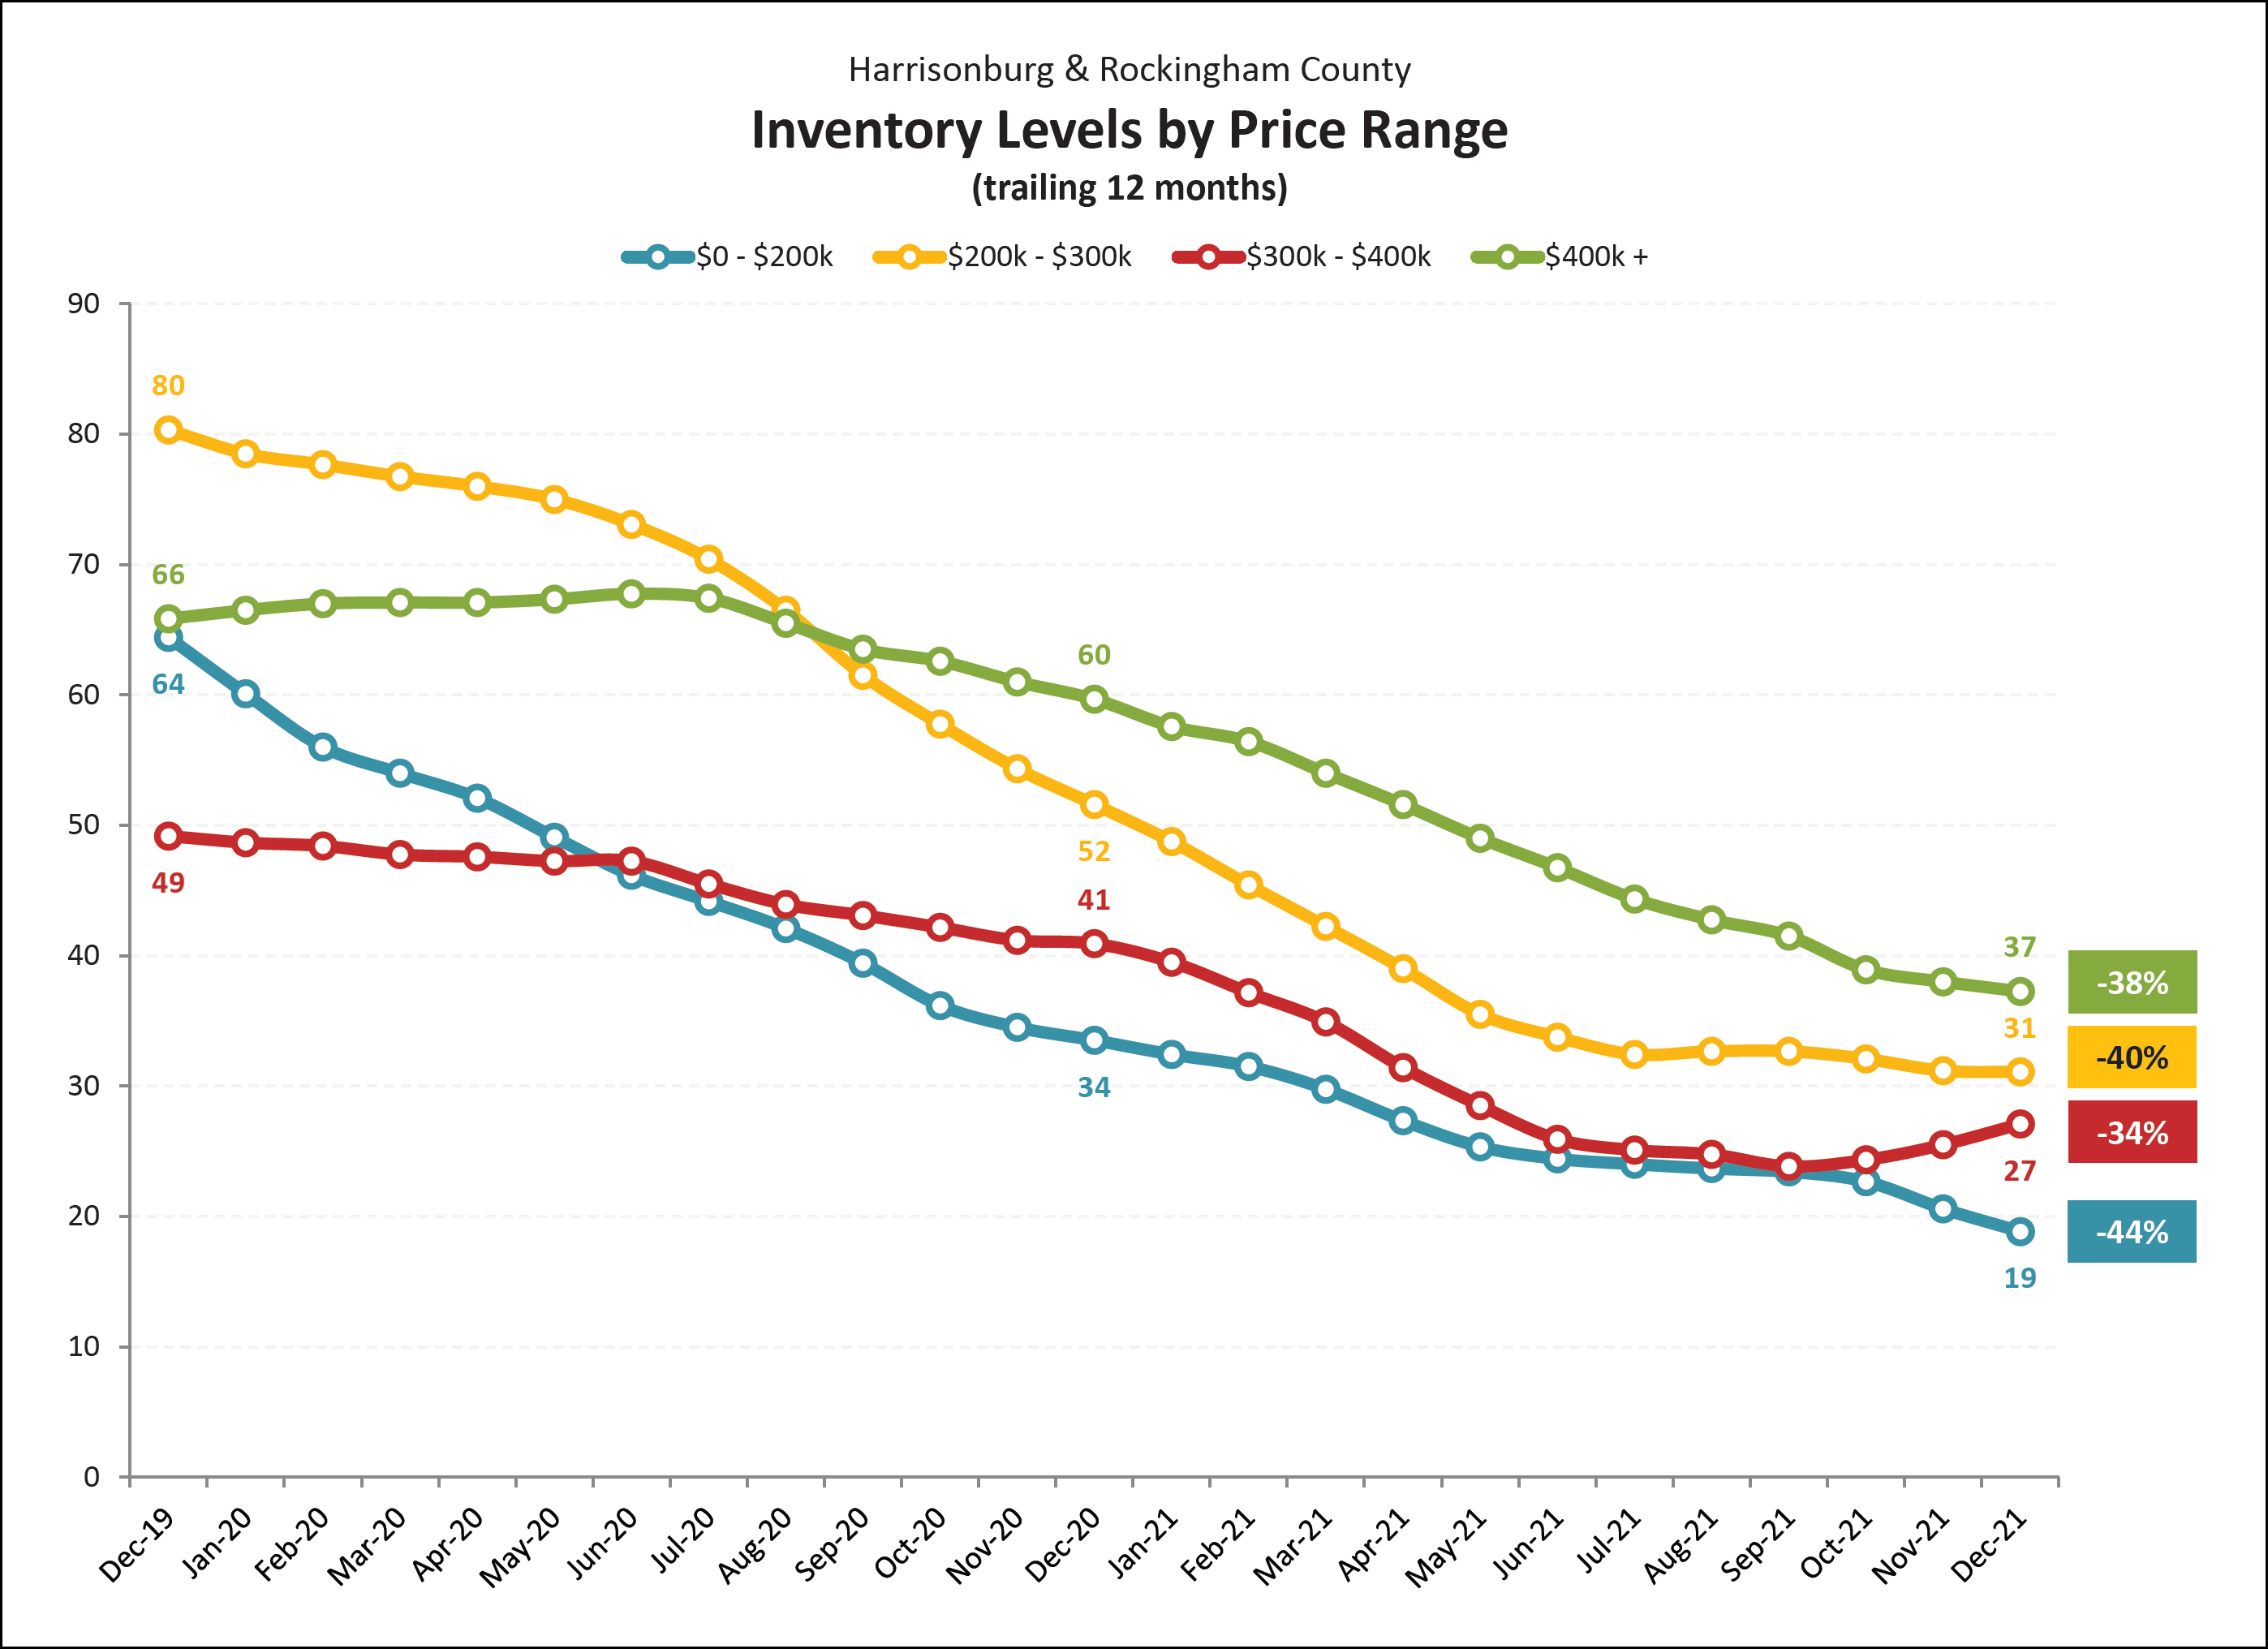
Inventory levels shift up and down seasonally, so this graph (now) looks at changes in average inventory over a 12 month period. We are now only seeing slightly different trends in inventory levels between different price ranges. All prices ranges shown above have seen a 34% to 45% decline in inventory levels over the past year. Some, but not all, of these changes in inventory levels are due to changes in market value (increases) over the past few years. We are not likely to see inventory levels start to meaningfully increase in any of these price ranges unless we see a significant increase in new construction in the area.
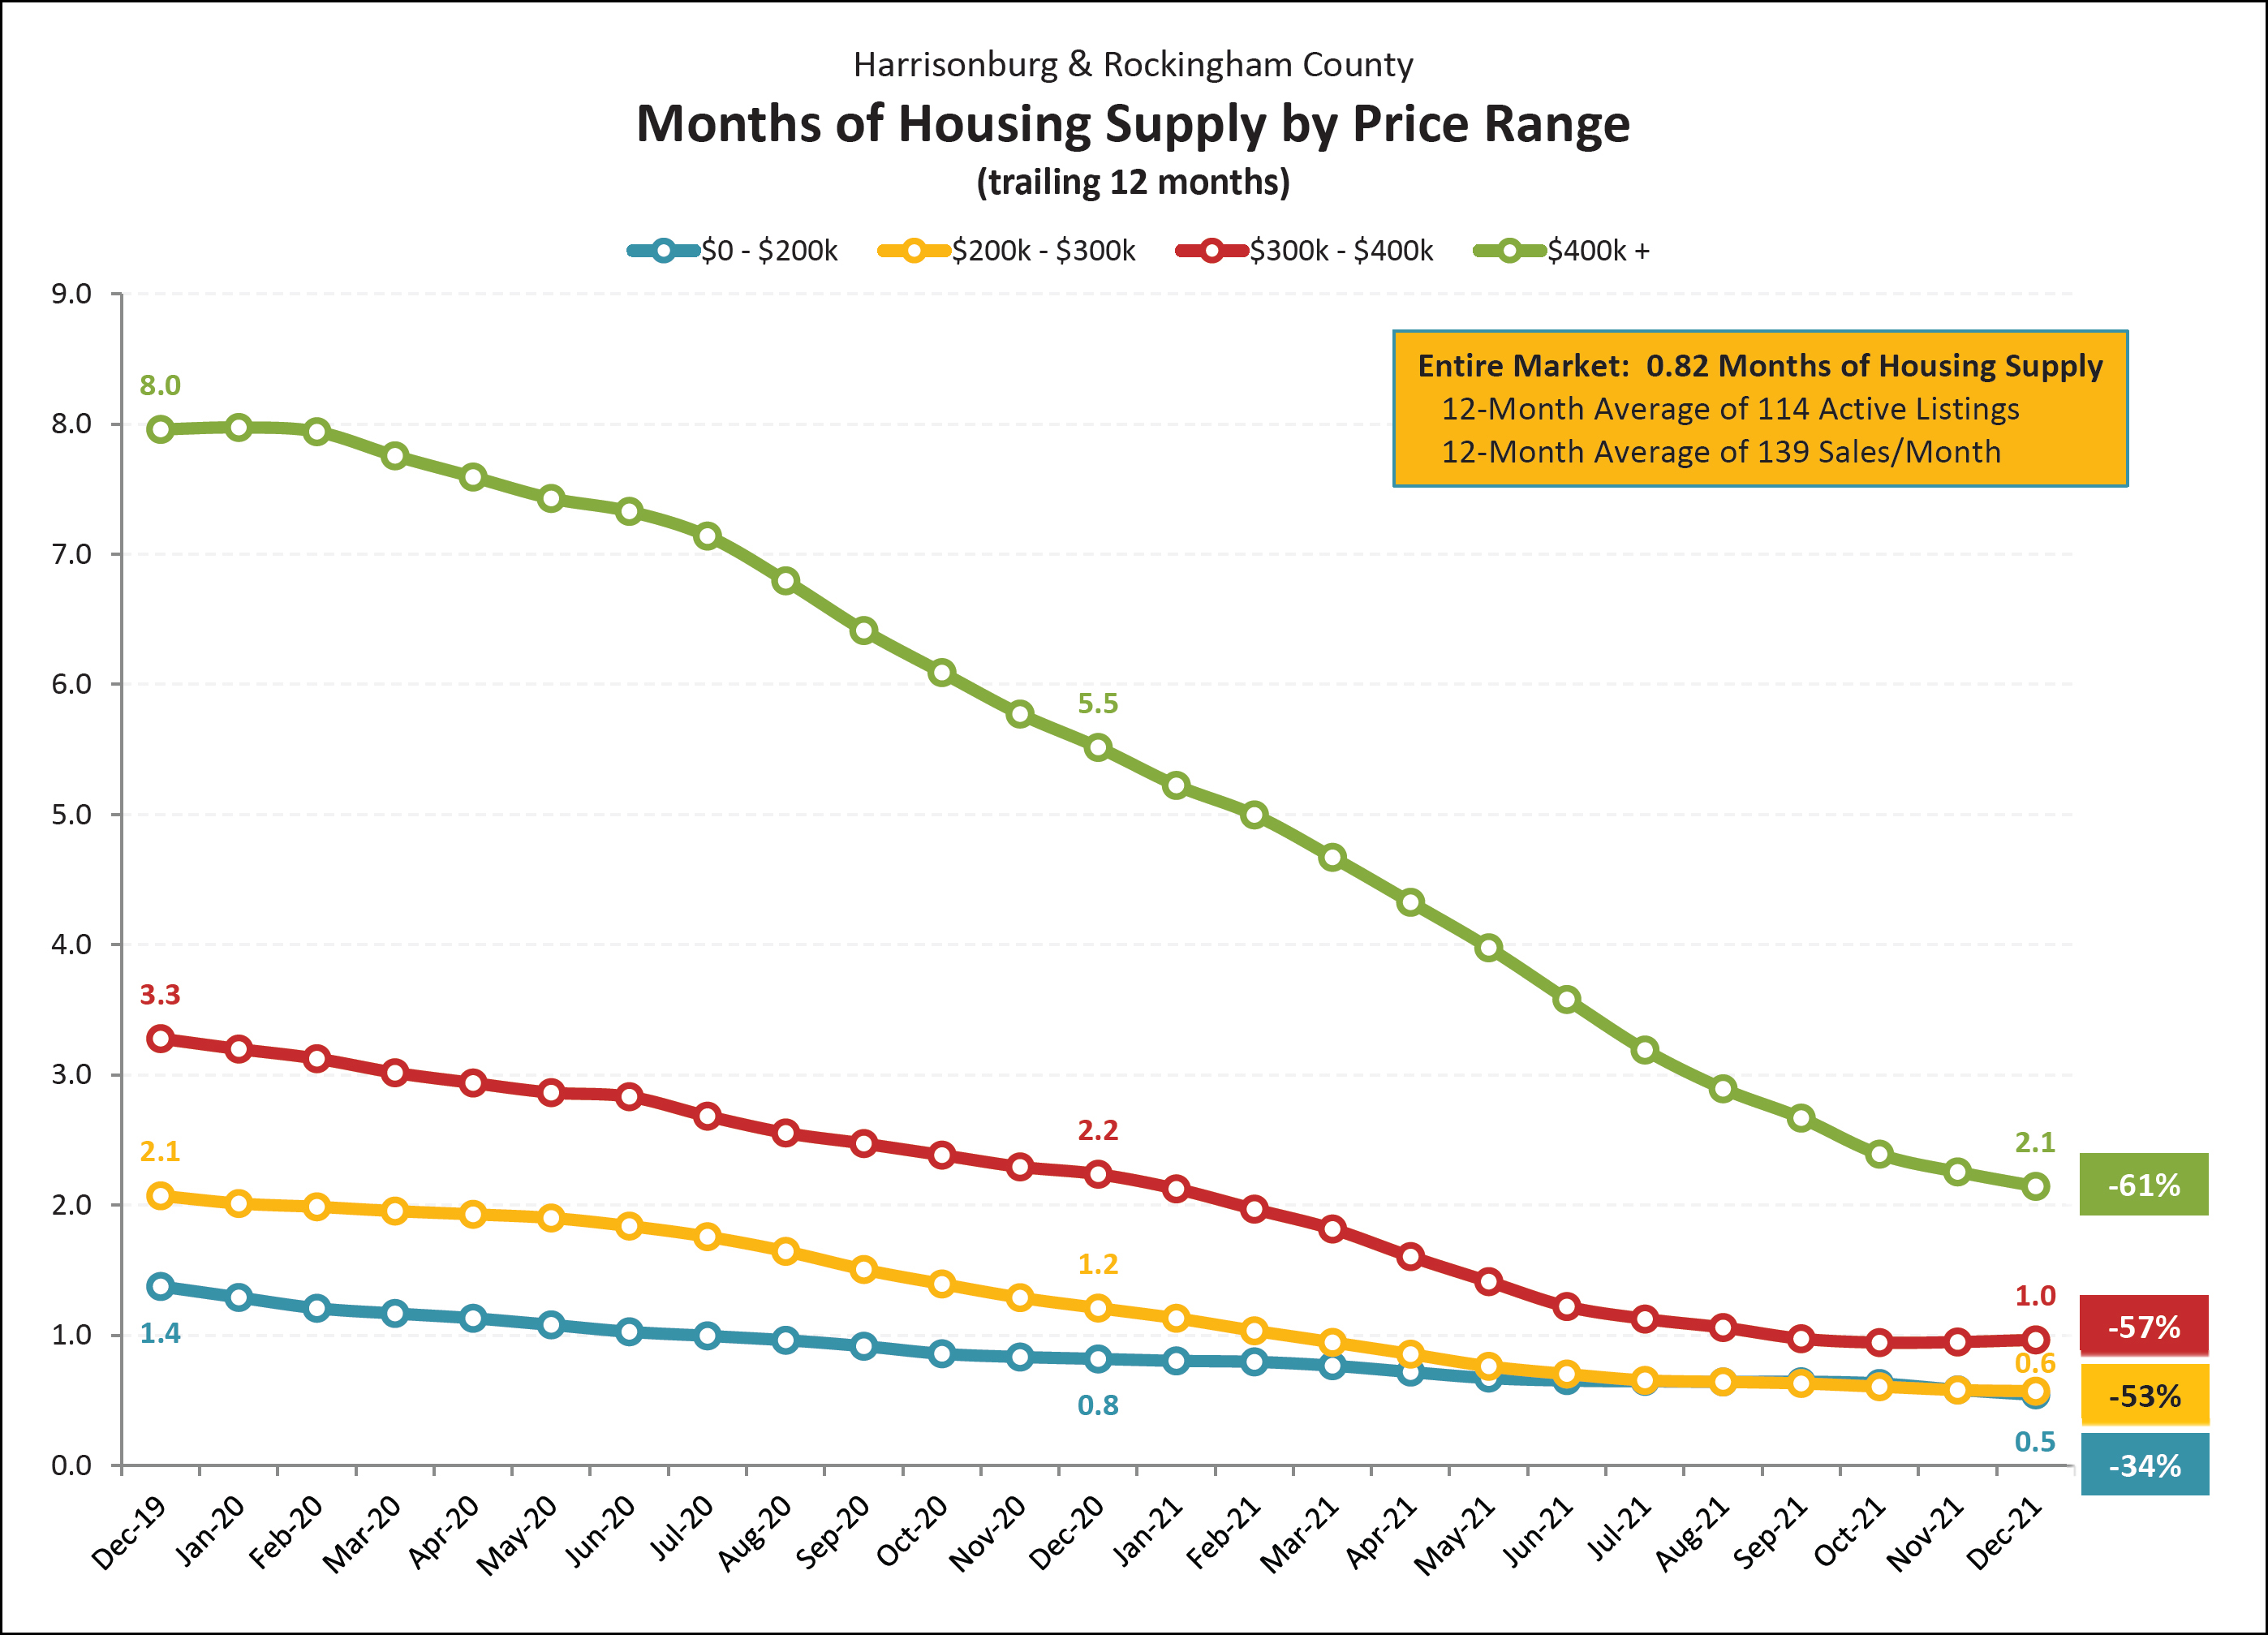
With so many home sales (lots of buyers) and so few homes on the market (not so many sellers), there are low levels of supply in most price ranges in our local real estate market. The graph above illustrates that while it would take about two and a half months to sell all of the homes currently for sale over $400K if the same number of buyers bought each month as have been buying (on average) over the past 12 months and if no new listings came on the market -- but it would take a month or less (!!!) to go through the inventory under $400K. Many consider a six month supply to be a balance between buyers and sellers.
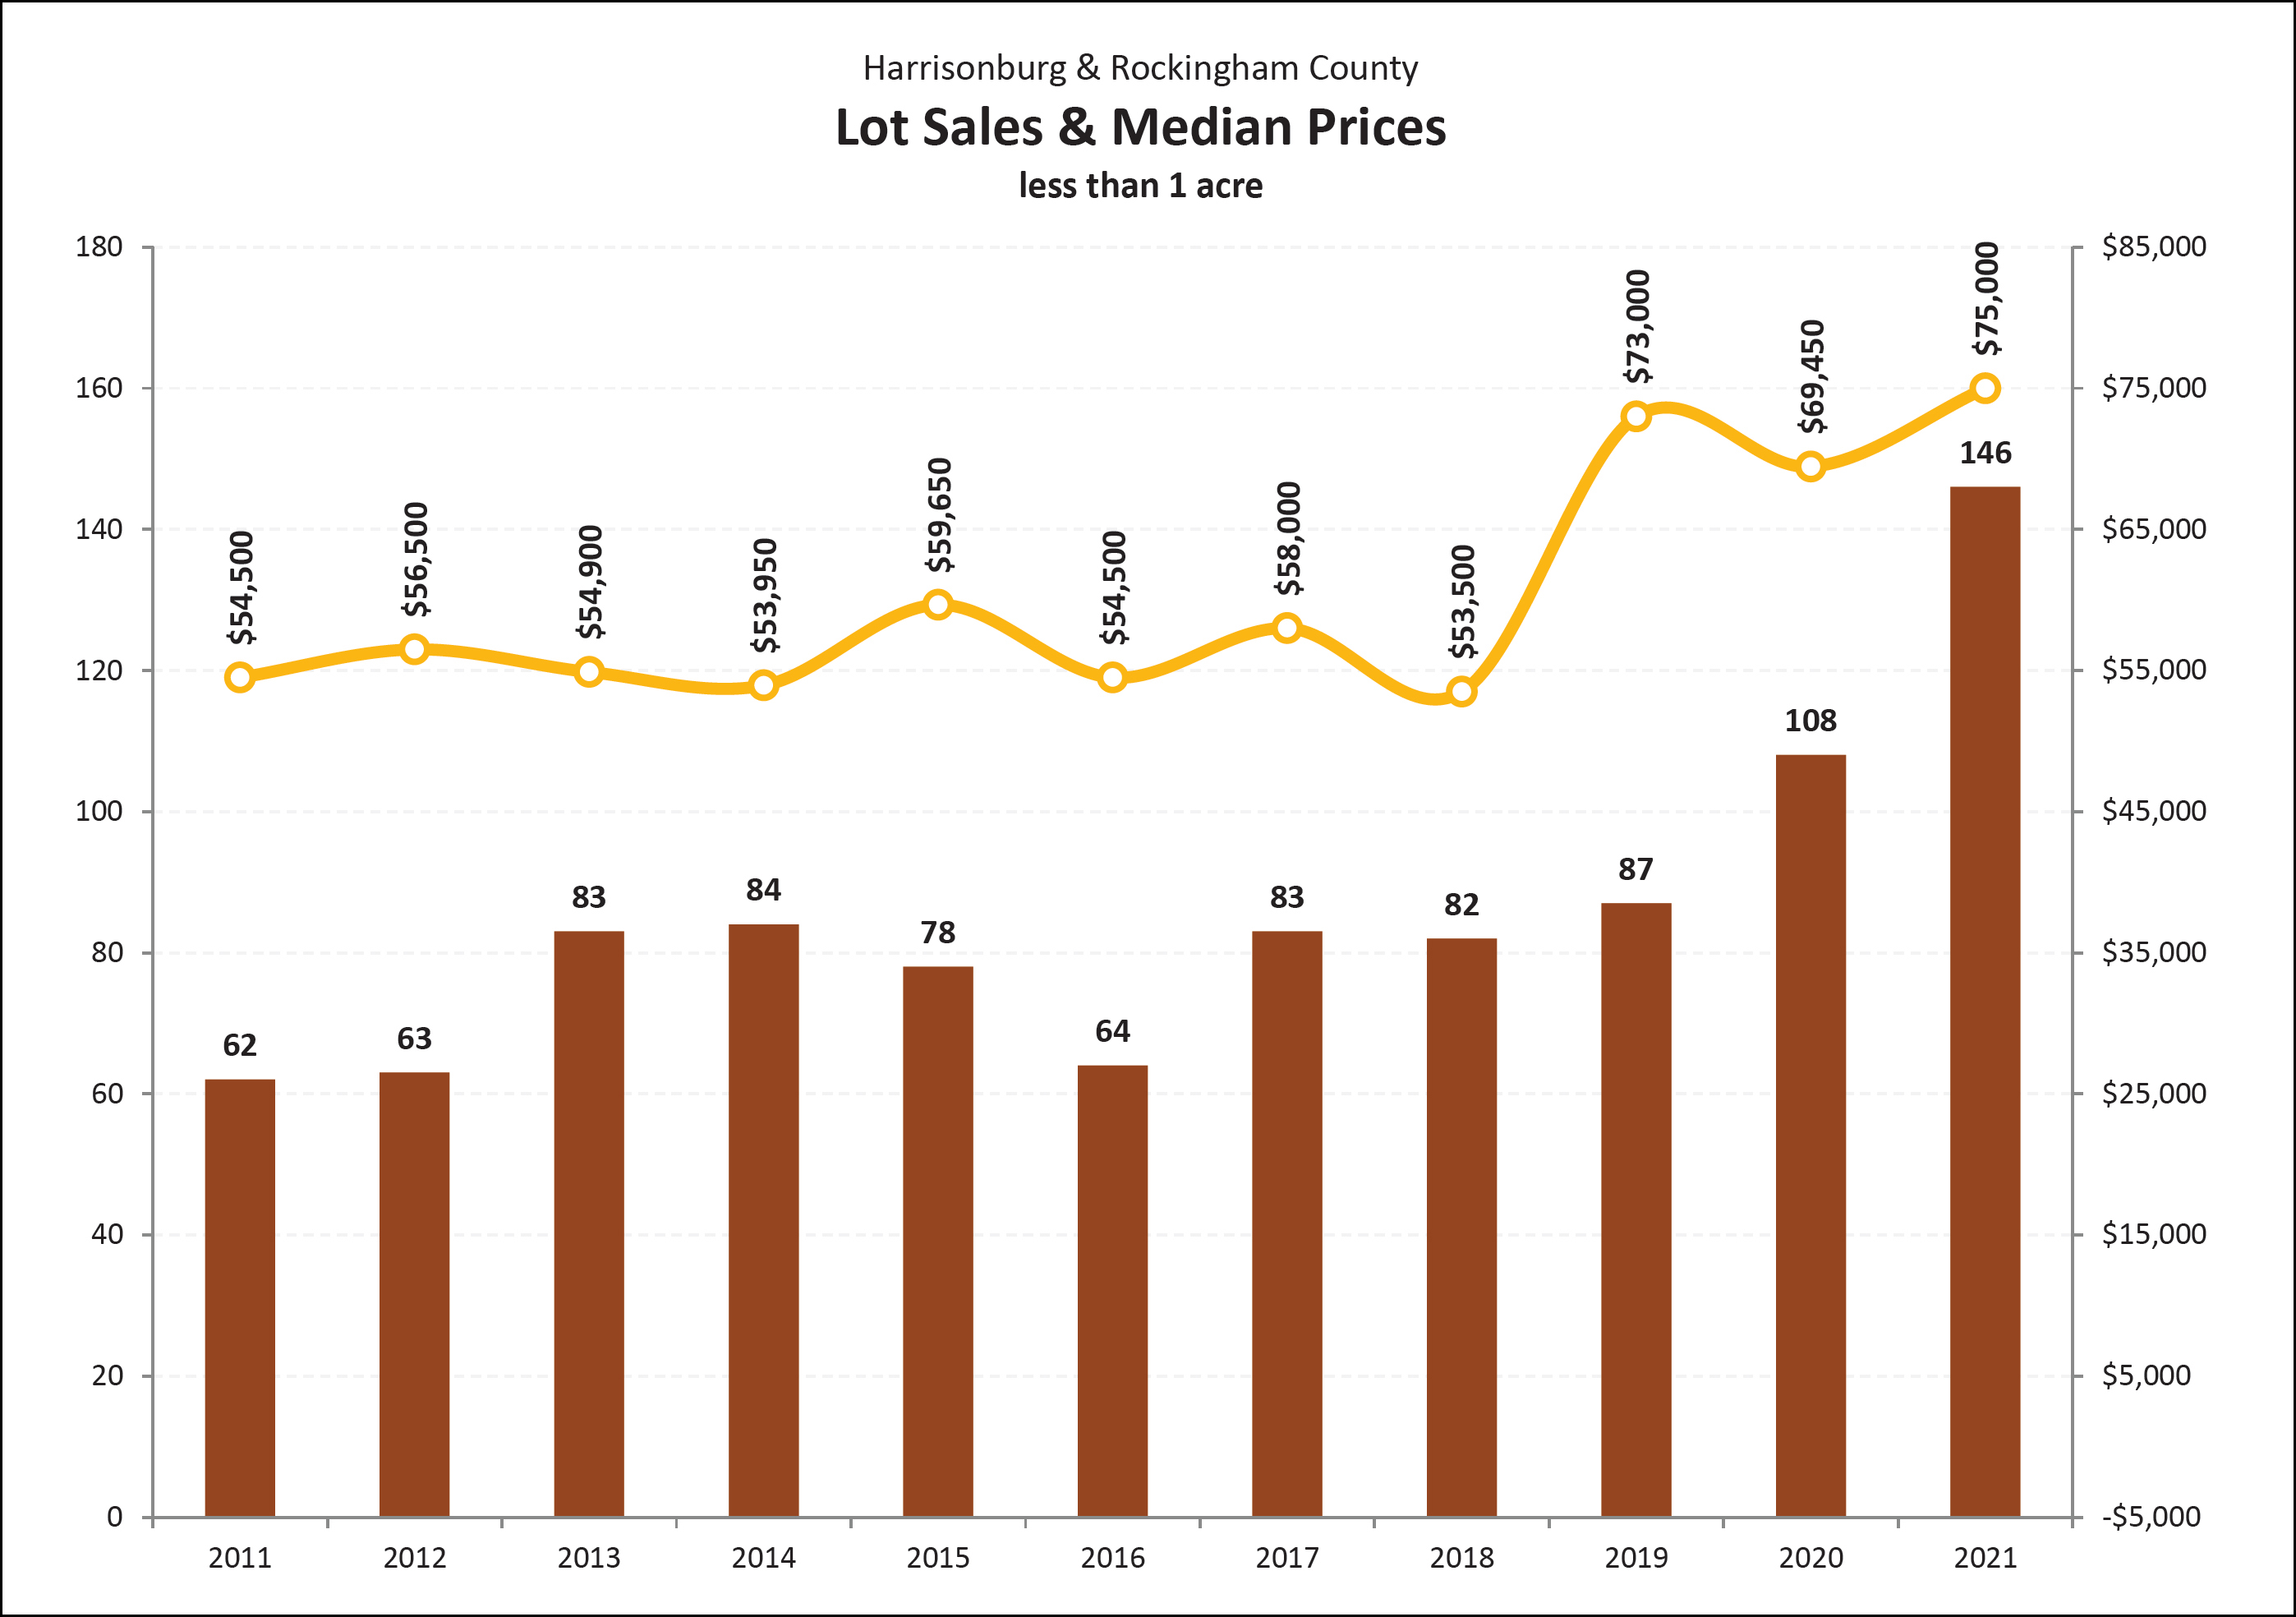
For six of the past seven years we have seen right around 80 sales per year of lots of less than an acre in Harrisonburg and Rockingham County. In 2020, that annual pace of sales increased a good bit to 108 sales of building lots. Despite that increase in the number of lot sales, the median sales price for those lots declined slightly to $69,450. That decline is likely a result of which particular lots sold, not necessarily an indication that all lots are selling at lower prices now than they were a year ago. We then saw 146 lot sales in 2021, which means last year was the strongest year of lot sales in the past decade.
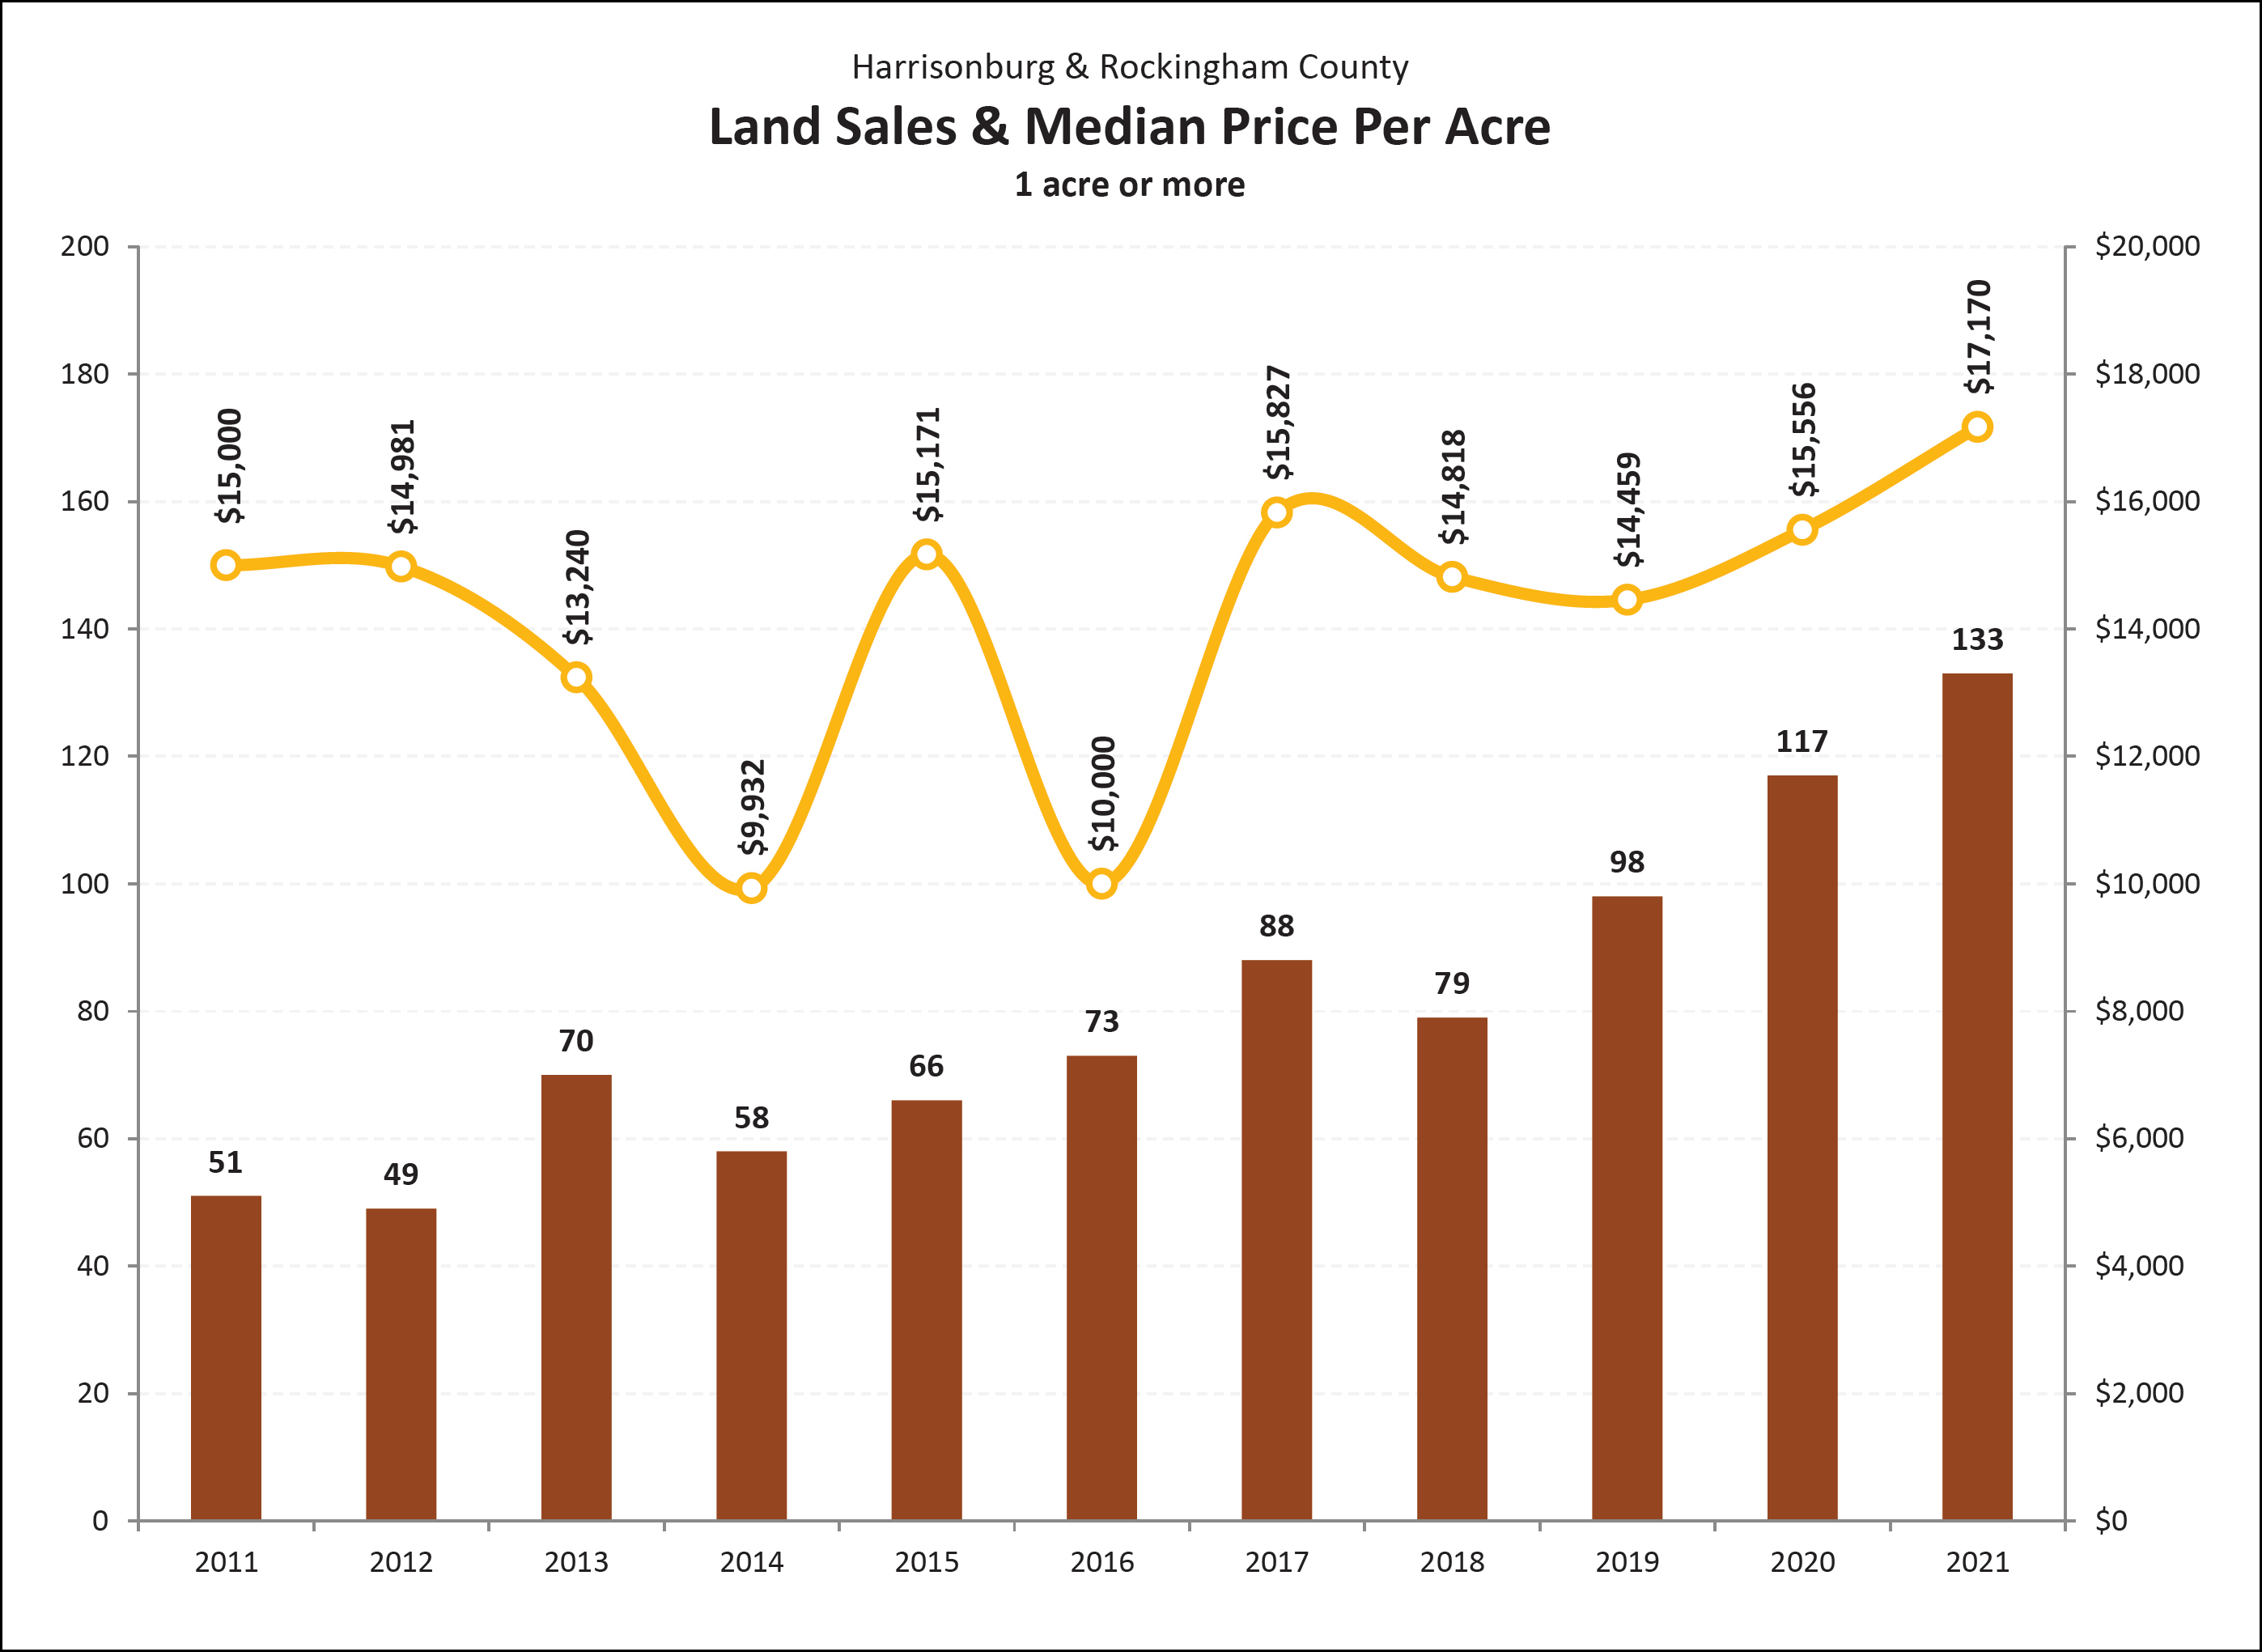
The pace of sales of parcels of land larger than one acre in Harrisonburg or Rockingham County has increased over the past ten years to 133 land sales in 2021-- marking the highest year of sales in over 15 years. The median price per acre had remained right around $15,000 per acre for four years between 2017 and 2020 but increased to just over $17,000 in 2021. Of note -- some aspects of this “median price per acre” calculation are affected by which parcels actually sell in a given year. The increase in buyer demand over the past 10 years has not seemed to have created any significant upward lifting pressure on values to date.
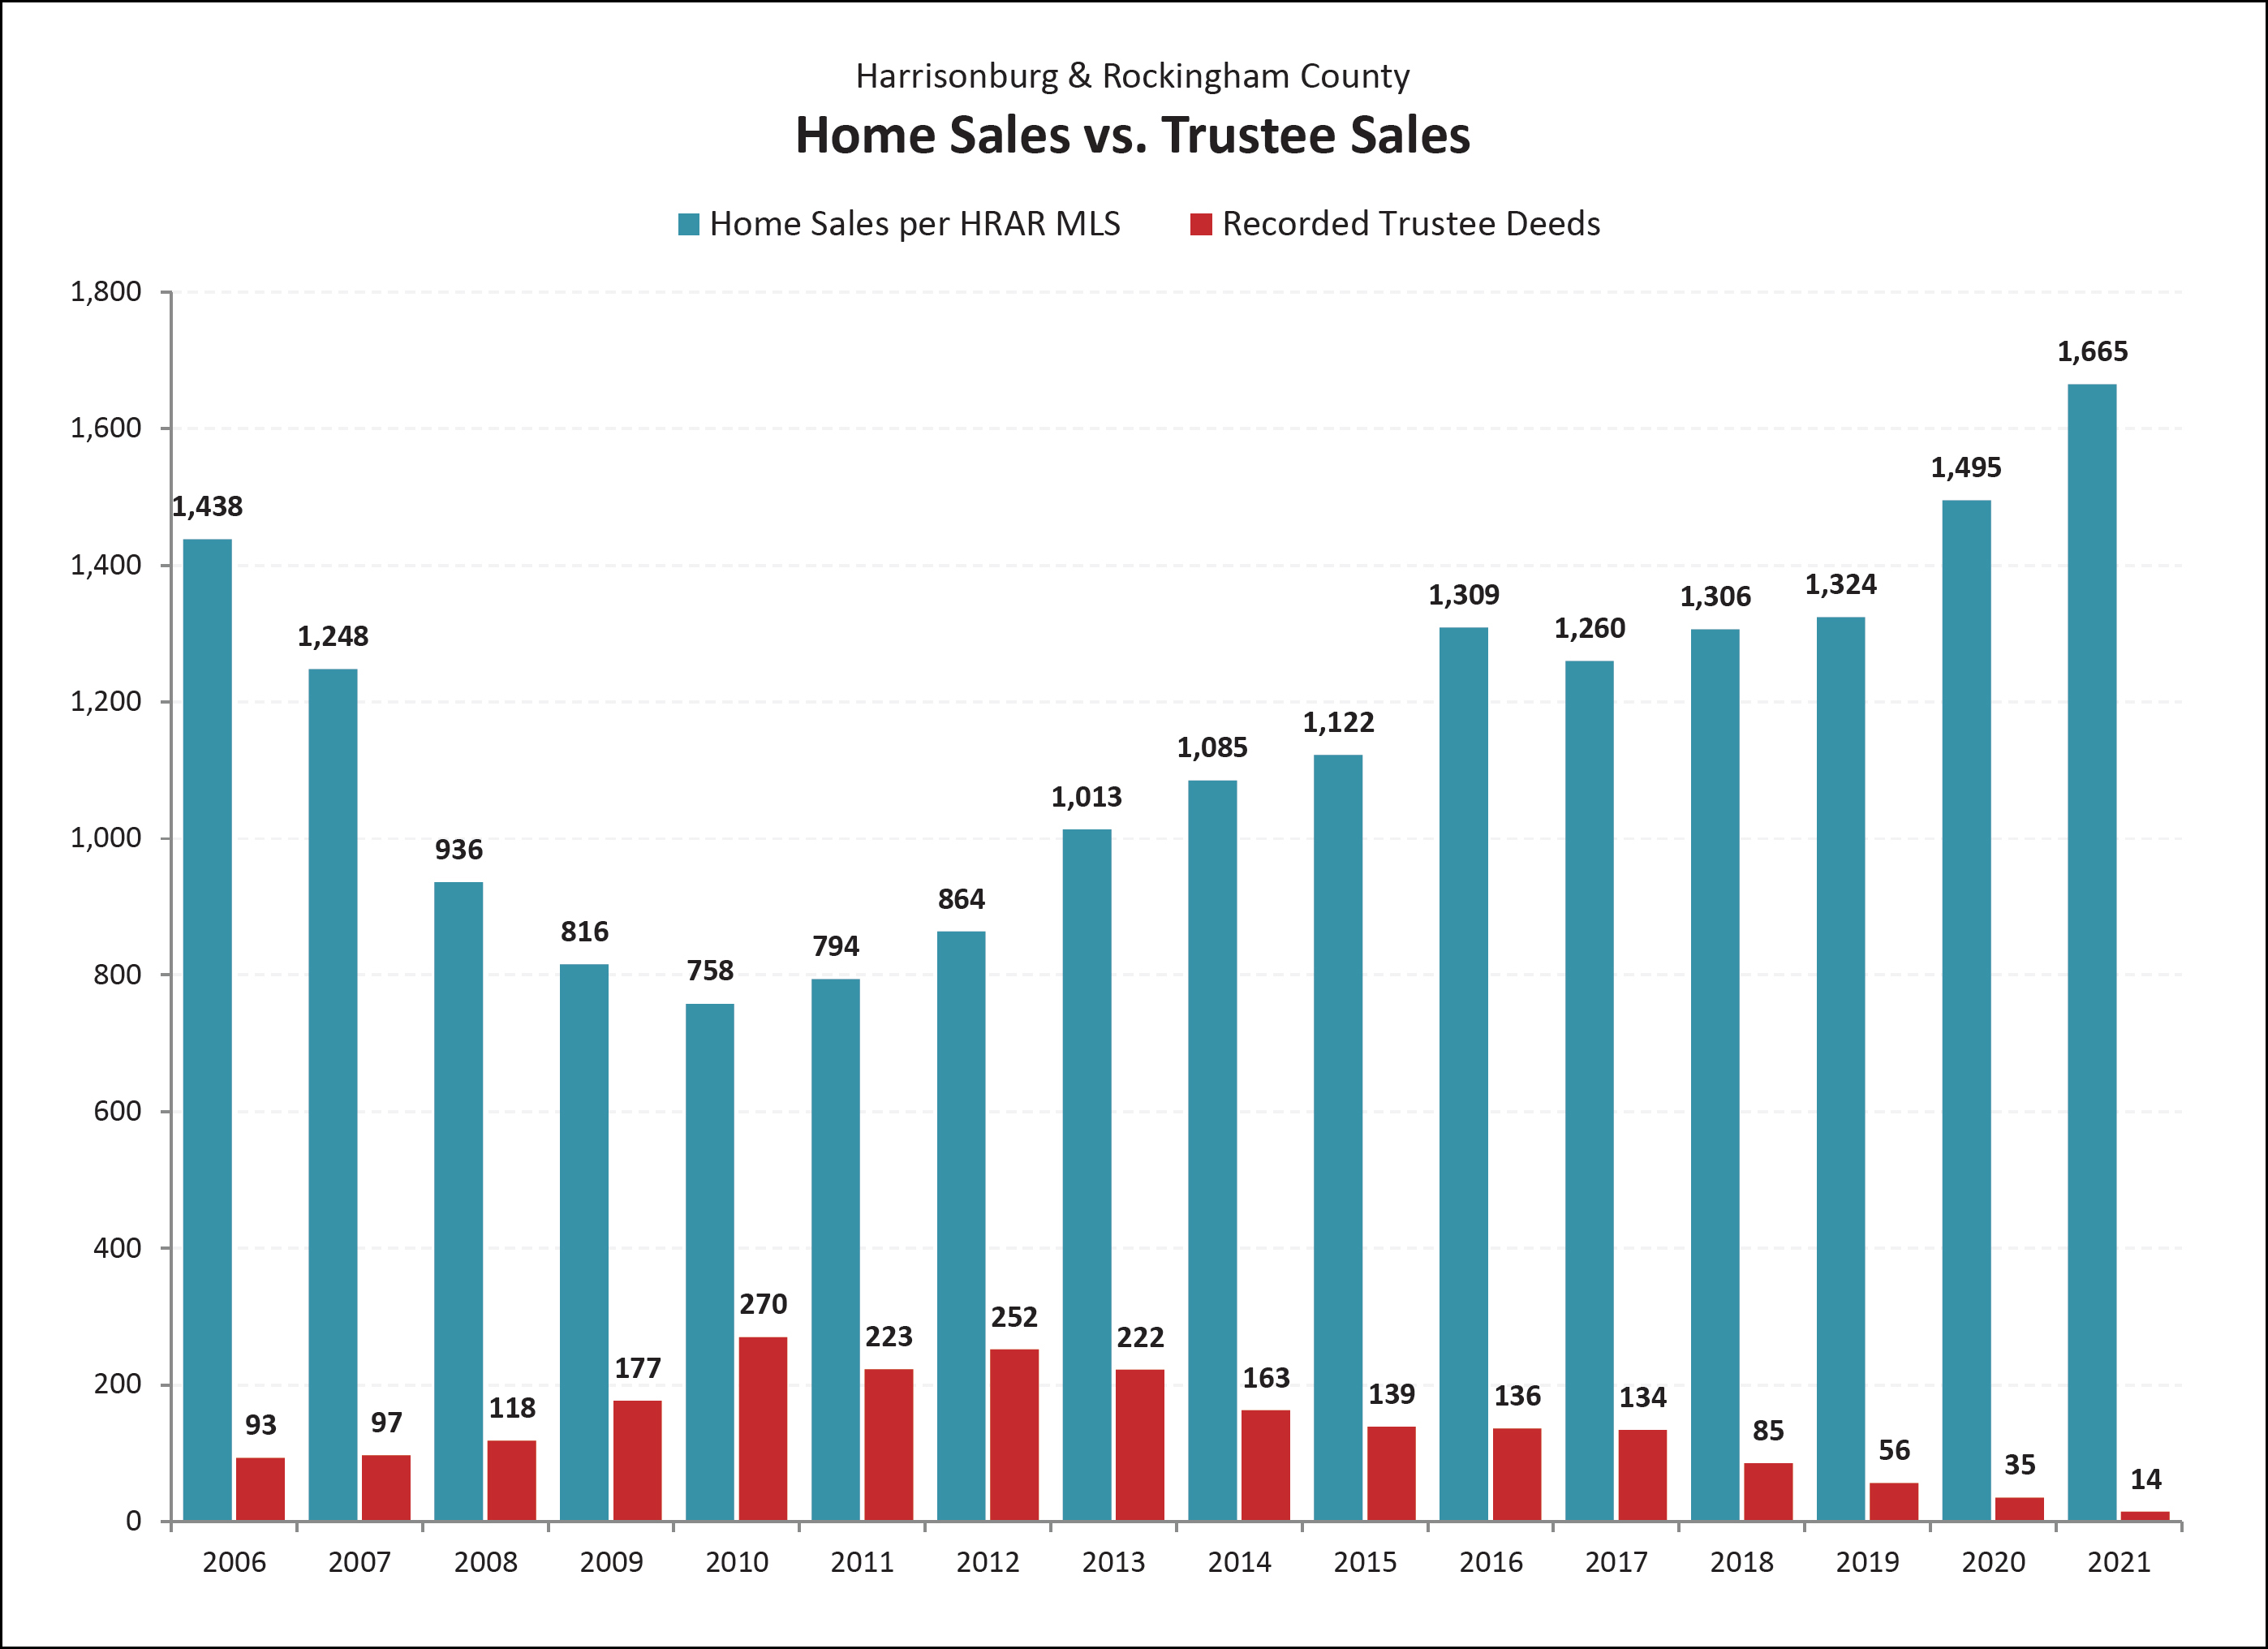
The graph above is a comparison of two imprecise measures -- but the comparison can still be helpful. The blue bars show the number of home sales recorded in the HRAR MLS -- this does not include private sales that did not involve a Realtor, nor new home sales directly from a builder. The red bars show the number of recorded Trustee Deeds. Some foreclosed properties then show up again as REO properties. The foreclosure rate in our local market area has been trending downward over the past nine years and is now at the lowest level seen anytime in the past 15 years! The moratorium on foreclosures likely kept that figure low in 2020 and 2021.
The graph above is a comparison of two imprecise measures -- but the comparison can still be helpful. The blue bars show the number of home sales recorded in the HRAR MLS -- this does not include private sales that did not involve a Realtor, nor new home sales directly from a builder. The red bars show the number of recorded Trustee Deeds. Some foreclosed properties then show up again as REO properties. The foreclosure rate in our local market area has been trending downward over the past nine years and is now at the lowest level seen anytime in the past 15 years! The moratorium on foreclosures likely kept that figure low in 2020 and 2021.