
A service of Scott P. Rogers, Associate Broker, Funkhouser Real Estate Group 540.578.0102 | scott@HarrisonburgHousingToday.com
June 2022 Harrisonburg & Rockingham County Real Estate Market Report
June 17, 2022
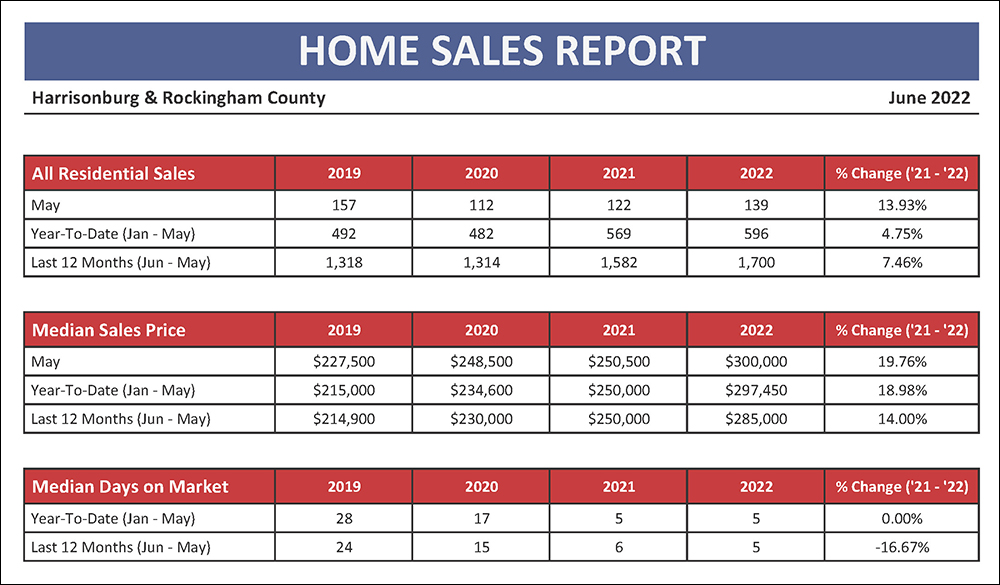
We saw more home sales this May than during either of the past two months of May... though if we look all the way back to May 2019 we will see a stronger month of home sales. Looking at the first five months of this year, we’ve seen 4.75% more home sales this year than last, and there has been a 19% increase in the median sales price of homes sold. Over the past 12 months, the pace of home sales has increased 7% and the median sales price has increased 14%! Homes keep on selling quickly at a median of five days on the market during the past 12 months.
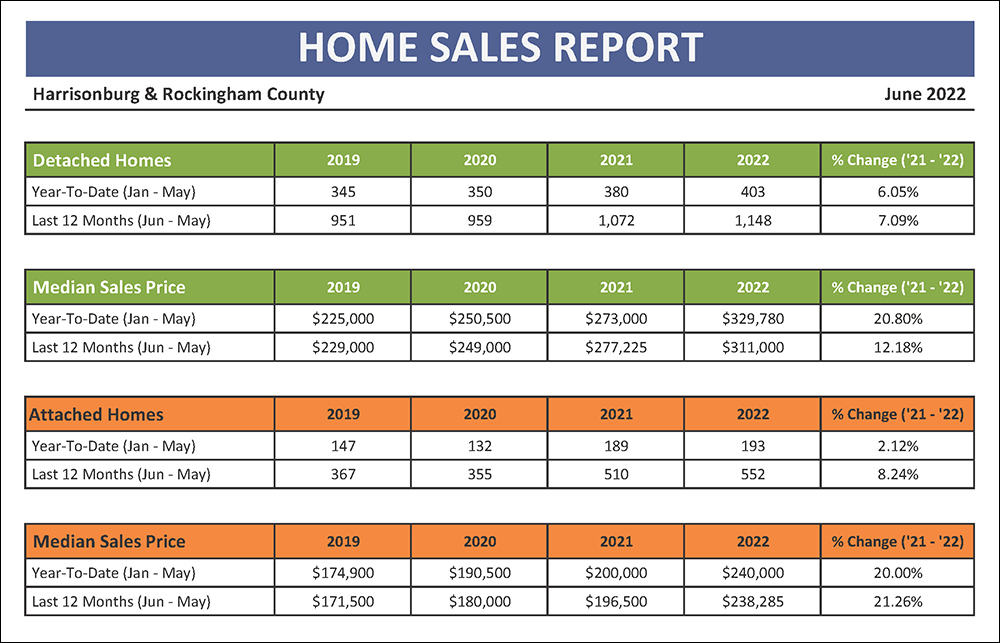
The green charts above shows trends in detached home sales -- as compared to the orange charts which show attached home sales, comprised of duplexes, townhouses and condominiums. Over the past 12 months we have seen an 7% increase in the pace of detached home sales, and a 12% increase in their median sales price. In contrast, there has been a slightly larger (8%) increase in the pace of attached home sales, and also a larger (21%) increase in the median sales price of those attached homes. The median sales price of detached homes is now up to $311,000 -- an increase of over $33,000 during the past year.
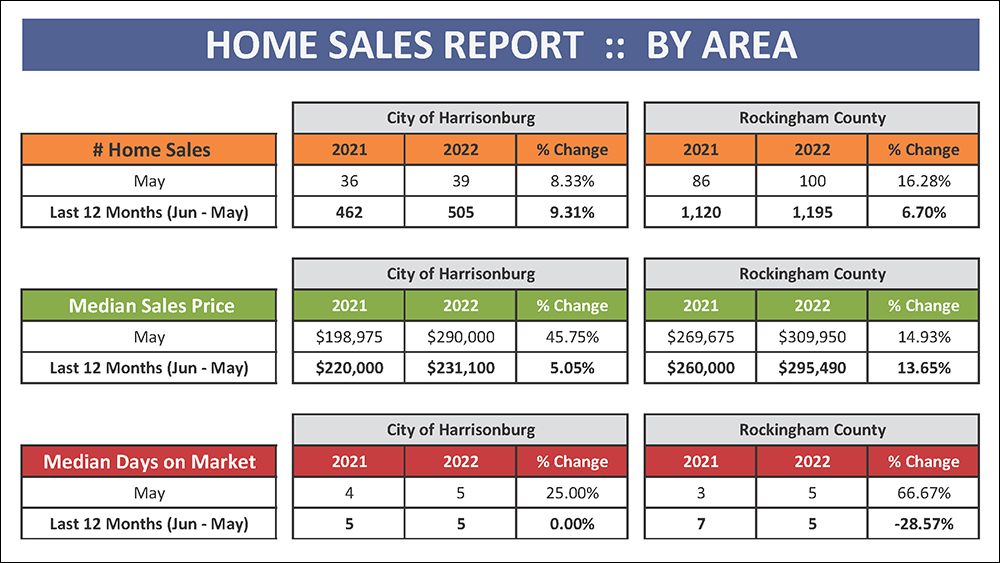
More than twice as many homes sell each year in Rockingham County as compared to the City of Harrisonburg. Over the past year we have seen a significant increase in City home sales -- with 9% more sales -- as well as a 5% increase in the median sales price of those homes. Meanwhile, in the County, the slightly lower, 7% increase in home sales over the past year, was accompanied by a larger 14% increase in the median sales price in the County. The median sales price in the County is a good bit higher ($295,490) than the City ($231,100) though likely because more townhomes, duplexes and condos are located in the City.
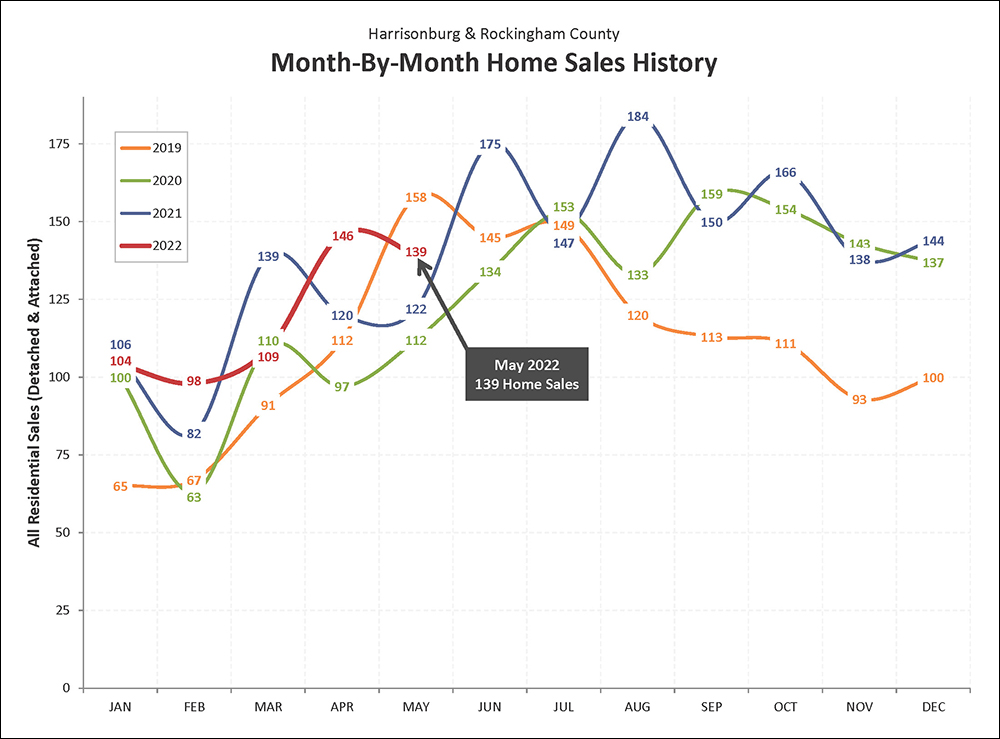
After a tremendously robust month of home sales in April, things did slow down a bit in May 2022 with only 139 home sales compared to 146 the previous month. Of note, the lower number of closed sales in May is a likely a result of contract activity in March and April, as it takes some time to get from contract to closing. With interest rates on the rise, it will take a few months to see what happens with home sales in June and July based on buyer decisions to buy (or not) in May and June. Last year, June was one of the strongest month of home sales all year... that is seeming unlikely to be the case this year... or at least not at this same (175) levels.
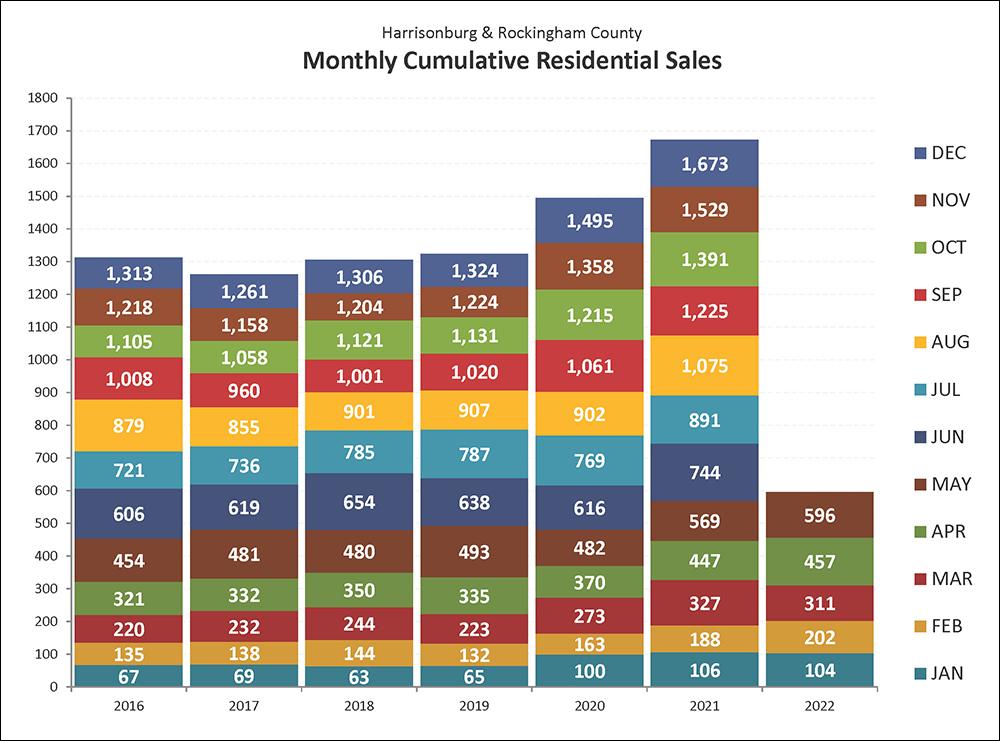
This colorful graph offers another way to look at the overall sales trends for the past few years in the Harrisonburg and Rockingham County housing market. For four years (2016-2019) we were consistently seeing about 1,300 home sales per year. Then, in 2020, at least partially fueled by primary and secondary effects of the Covid-19 pandemic, the pace of home sales escalated quickly in Harrisonburg and Rockingham County. We jumped from 1,300 sales a year up to nearly 1,500 in 2020 and then even higher (1,669) in 2021. Thus far, 2022 is keeping pace with -- and actually exceeding -- these two most recent very active years in our local market.
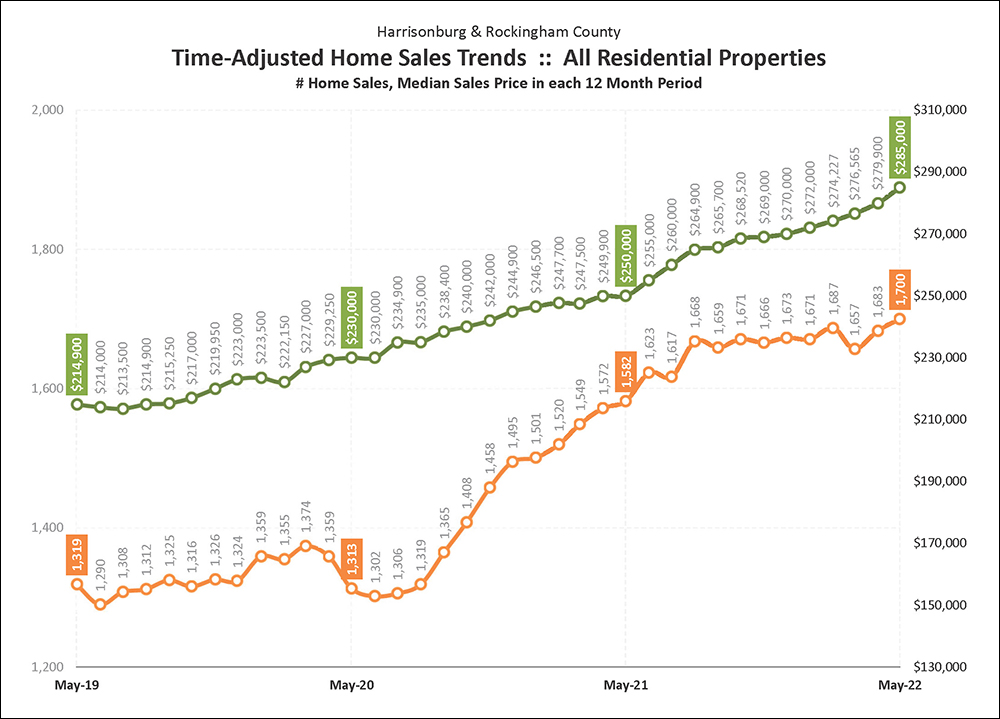
This graph shows a rolling 12 month trend line of the number of homes sold in the Harrisonburg and Rockingham County area, as well as the median price of the homes sold during these time frames. Each data point shows one year of home sales, which eliminates the volatility of evaluating sales figures on a monthly basis. The annual pace of home sales dropped off in late spring 2020 due to COVID but a few months later started rising rapidly, flying past 1,500 sales per year, then past 1,600, and now has hit 1,700 sales per year. The median sales price has been trending upwards for several years now and has reached $285,000.
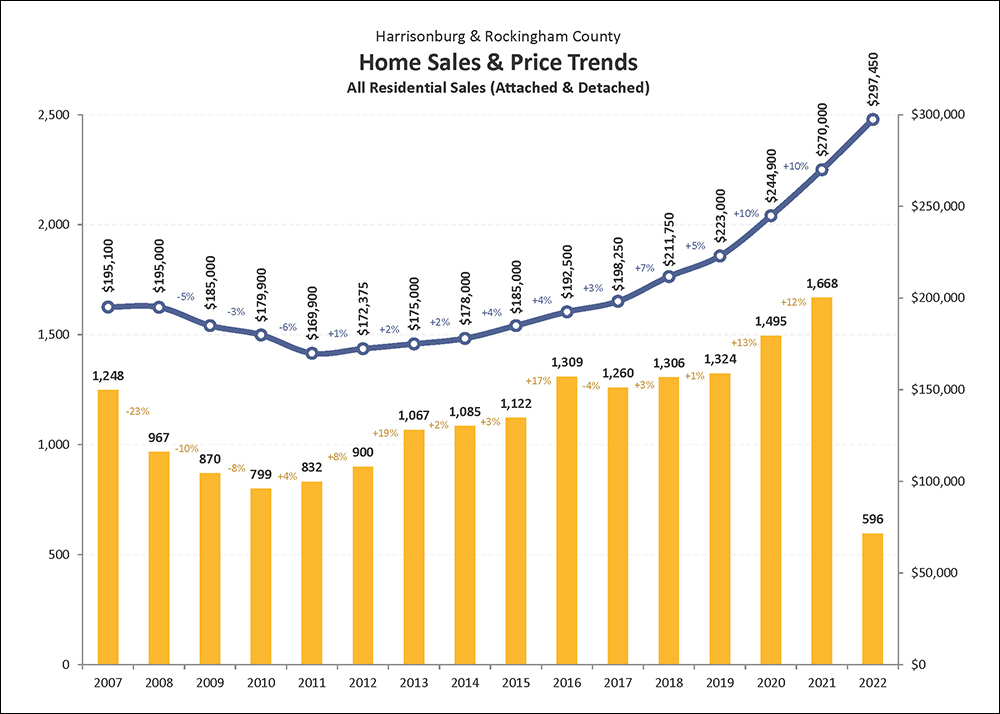
This graph provides an overall indicator of the state of our housing market, showing both the number of homes being sold each year (yellow bars) as well as changes in the median sales price during the same time period (blue line). Over the past 11 years we have seen relatively steady increases in the number of homes sold each year in Harrisonburg and Rockingham County - with a surprisingly large 13% increase in 2020 followed by another strong 12% increase in 2021. The median sales price has also been consistently increasing for ten years now, up to an all time high in 2021 of $270,000 thanks to 10% increase in 2020 and 2021.
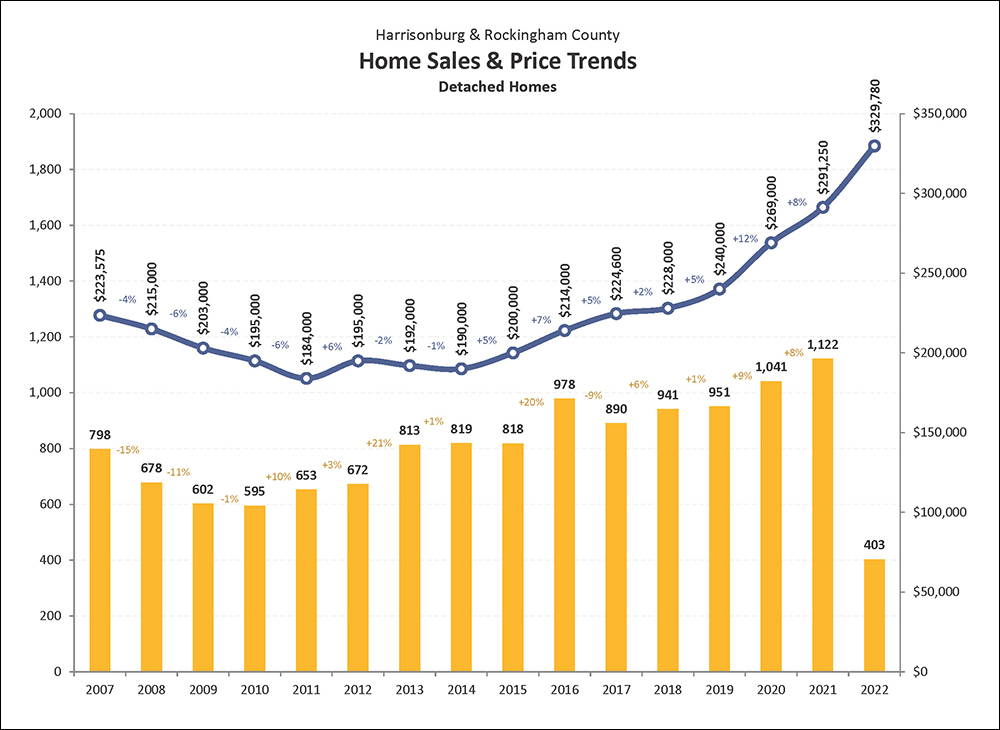
The single family home market in Harrisonburg and Rockingham County has improved rather steadily over the past 11 years with increases almost every year in the number of homes sold. After having peaked in 2016 with 978 home sales, we finally broke through 1,000 sales per year with 1,041 home sales in 2020 and we saw even more sales (1,122) in 2021. The median sales price has now been rising for seven years straight now, from $190,000 back in 2014 to a new (all time) high of $291,250 in 2020. The median sales price of detached homes rose 12% in 2020 and then 8% in 2021.
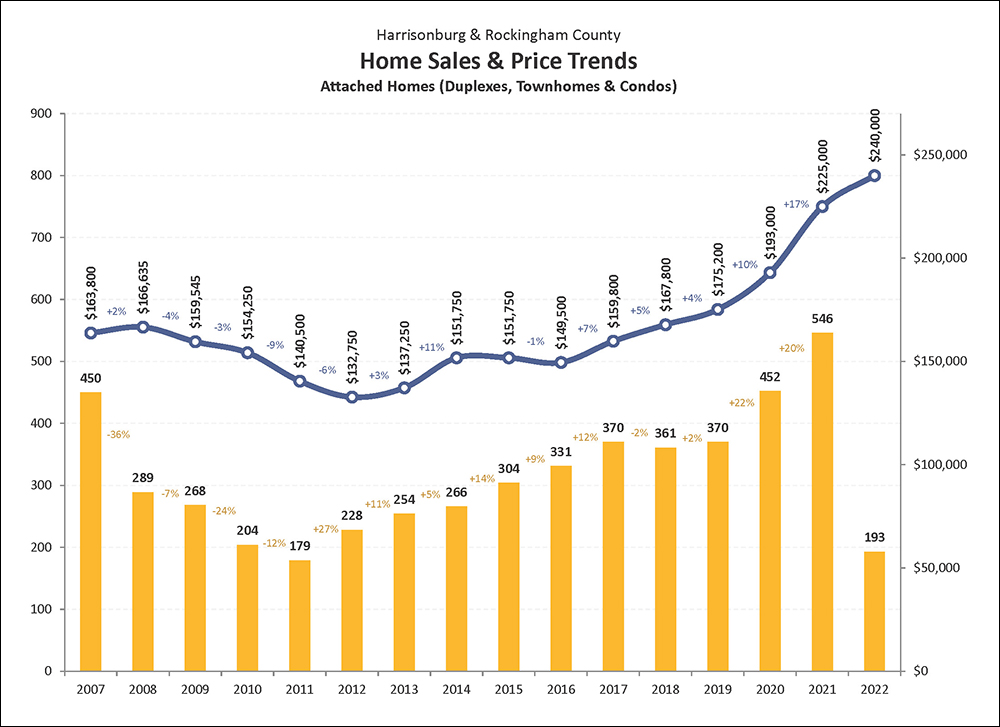
The pace of sales of attached homes (duplexes, townhouses and condos) rose steadily between 2011 and 2017 and then plateaued for a few years right around 370 home sales per year. But then, 2020. The sales of attached homes jumped significantly in 2020, showing a 22% year over year increase, with 452 home sales. This 22% increase in sales in 2020 was only slightly higher than the 20% increase in attached sales seen in 2021. The median sales price of attached homes has been rising (for the most part) for nine years now and has hit a new (all time) high of $225,000 in 2021, up from less than $150,000 only five years ago.
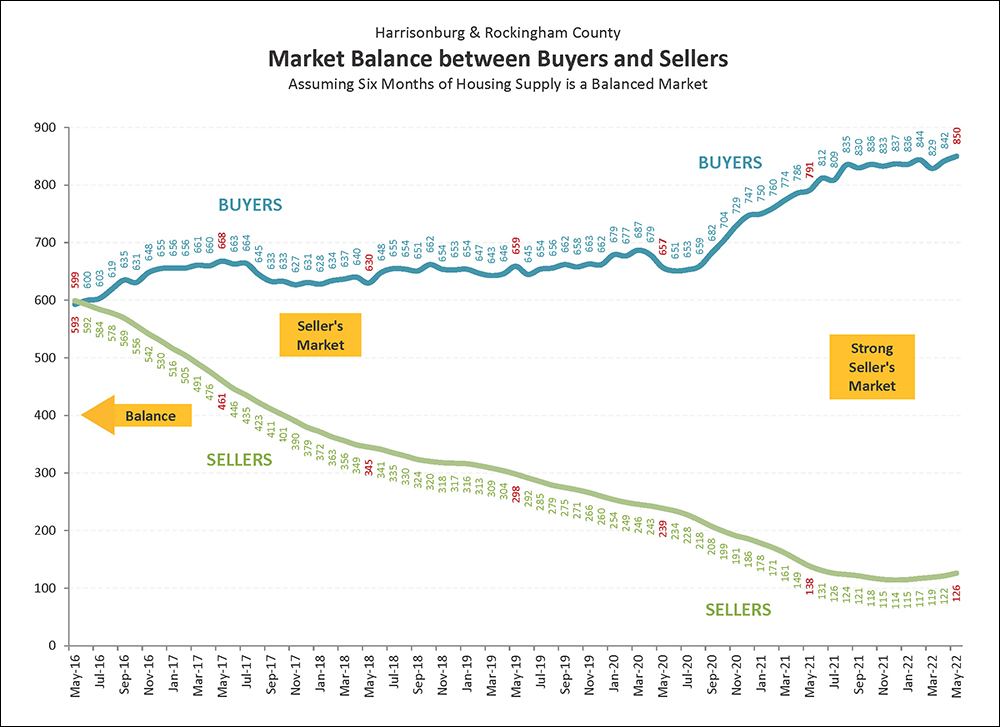
Historically, well before Covid, many had considered six months of inventory (active listings) to be an indicator of a balanced market between buyers and sellers, but many are reconsidering that metric now. The “BUYERS” trend line above shows how many buyers are buying in a six month period. The “SELLERS” trend line above shows how many sellers are in the market (active listings) at any given time. Over the past several years we have seen a steady increase in buyers and a declining number of sellers. We now see many (many!) more buyers buying in a six month period than there are homes for sale at any given time.
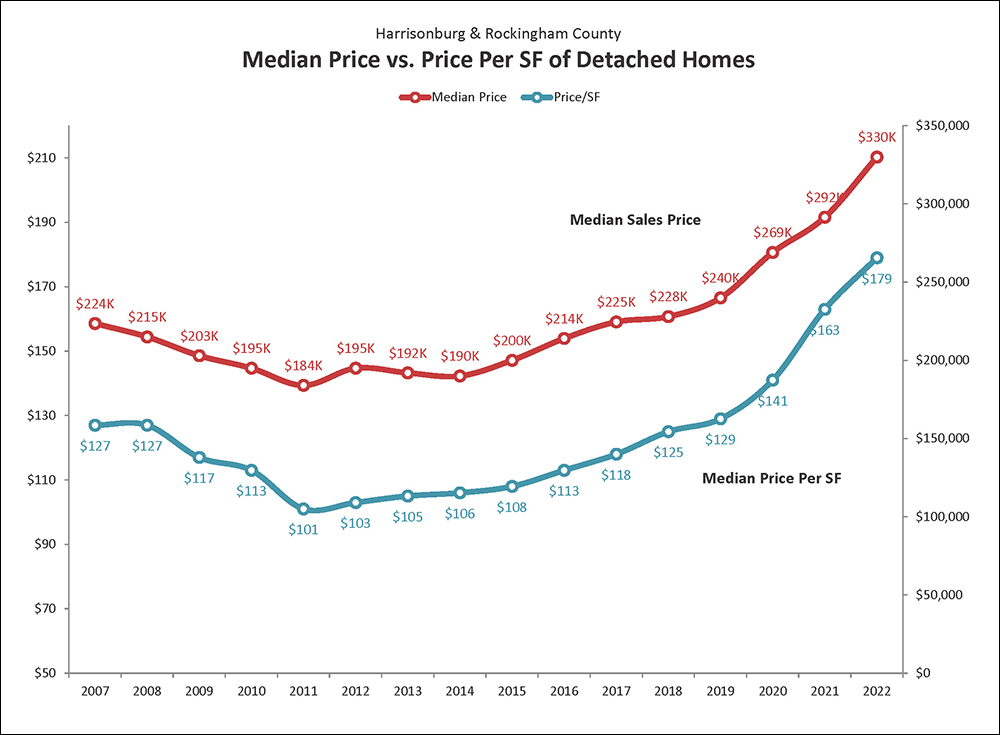
In addition to monitoring home values by overall median sales prices in our market, it can be insightful to examine the median price per square foot of homes that are selling. The graph above shows the median price per square foot of all single family homes sold over the past 15 years. The value trend captured by this graph is quite similar to the trend shown in the single family home median sales price during the same time, which validates that assumed set of changes in home values. Over the past several years (2015 through 2021) we have seen increases in the median sales price as well as the median price per square foot of single family homes.
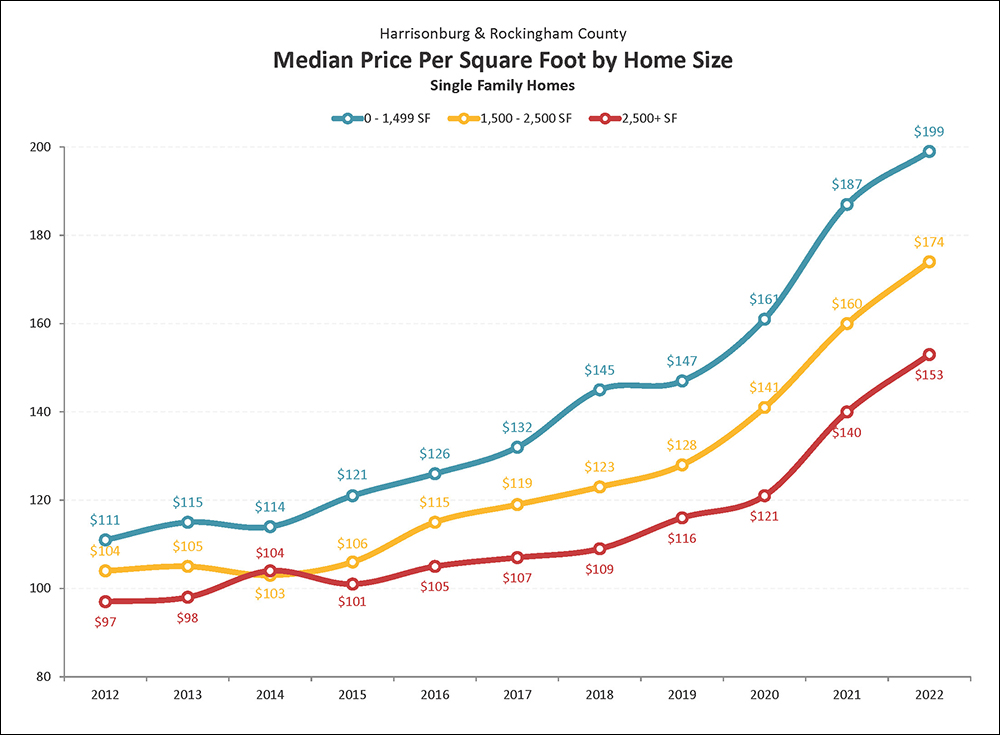
Price per square foot of single family homes certainly varies for many reasons, including the age, location, lot size and structural characteristics of each home sold. However, there are some similarities in homes of similar sizes. Looking at 2021 figures, this graph illustrates that the median price per square foot of larger homes (2500+ SF) was a good bit lower than that of homes with less than 1500 SF during nearly every year. These values cannot be used as an absolute standard against which the value of any home can be measured, but they can provide some helpful guidance when trying to determine the value of a home.
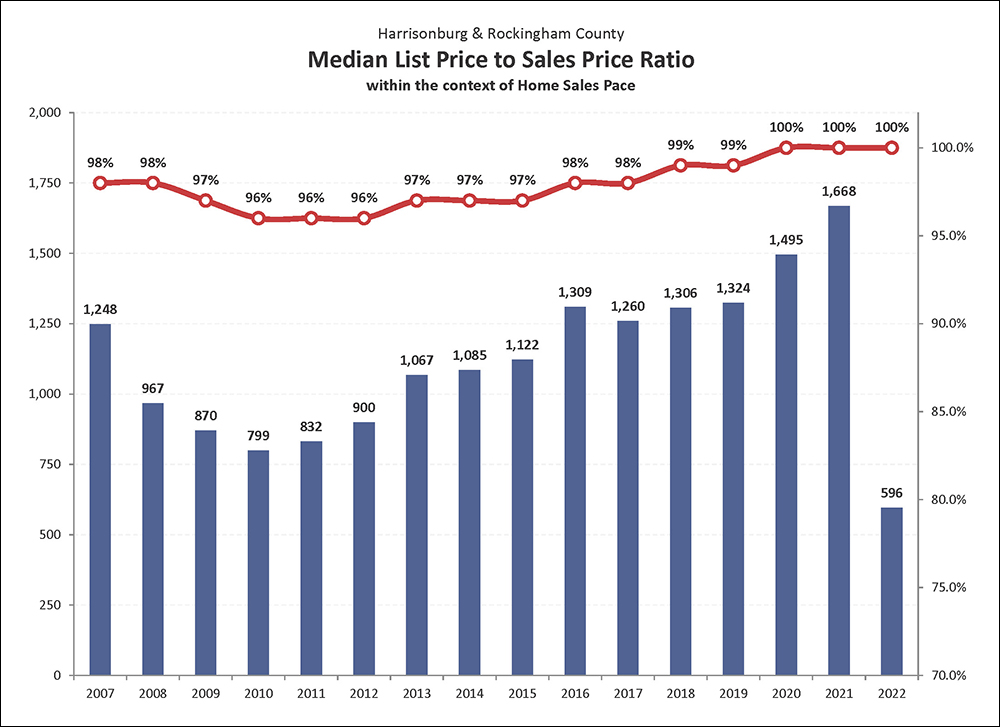
This graph shows the average list price to sales price ratio (red line) over the past 15 years as compared to the overall pace of home sales. At the peak of the housing boom (2004-2006) sellers were able to obtain a median of 99% of their asking price. Then, when the pace of home sales slowed (through 2010) this metric dropped to 96%, where it stayed for three years. Sellers started selling for slightly more in 2013-2015 when they could obtain 97% of their list price. This increased to 98% in 2016 (remained there in 2017), and was been holding at 99% since 2018, but popped up to a median of 100% in 2020 which held 2021.
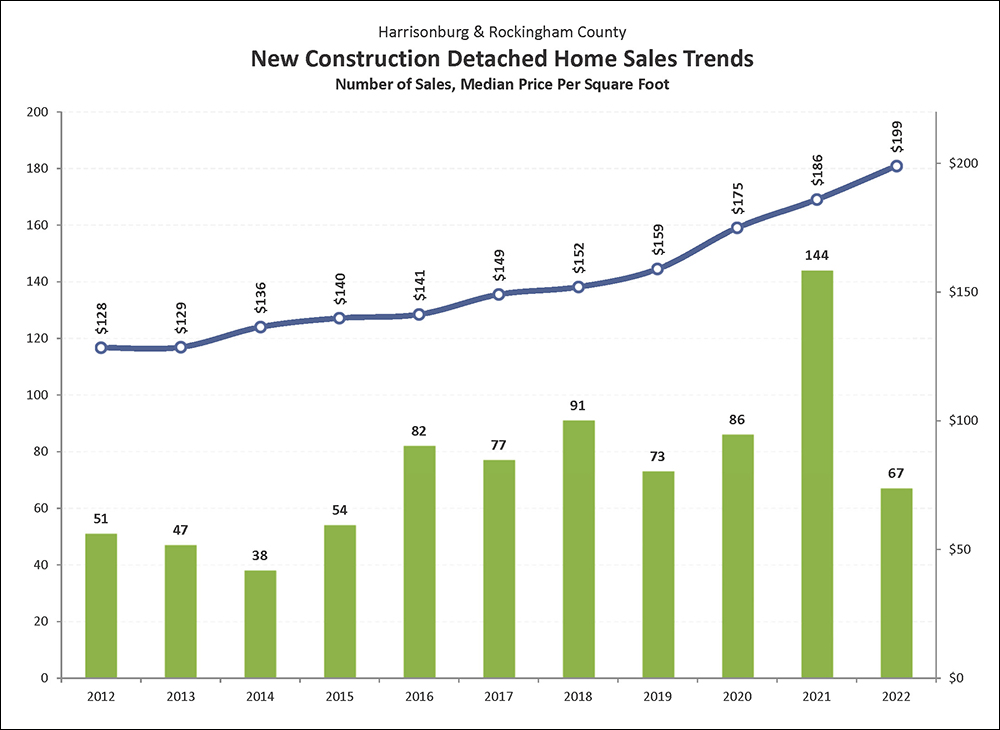
New home builders built a record number of new homes in Harrisonburg and Rockingham County last year -- 144 -- approaching twice the number built per year in many of the past five to ten years. These figures, of course, only represent new homes being marketed through the MLS. Plenty of additional new homes are built by local home builders on lots already owned by the person who will live in the home - and thus they do not show up in the MLS. These new home sales show a steady increase in the price per square foot of homes being built and sold over the past ten years, with the largest increase in that value taking place in 2020.
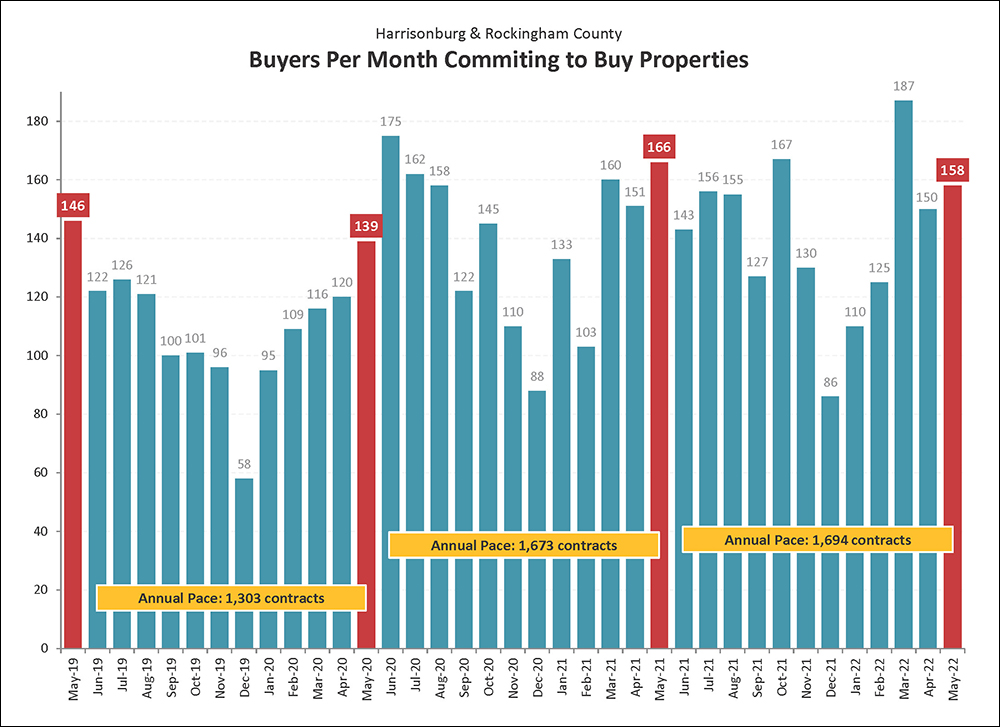
Contract activity, buyers and sellers signing contracts to buy and sell homes, are the leading indicator of what we will see in future months of closed sales transactions. Interest rates have been on the rise for several months now so many assumed we would start to see a decline in buyer activity. If we are going to see a significant slow down in buyers buying houses it does not seem to be happening yet. Only a slightly smaller number of buyers contracted to buy homes this May (158) as did so in the same month last year (166) in Harrisonburg and Rockingham County. The market does not yet shown any signs of a significant slow down.
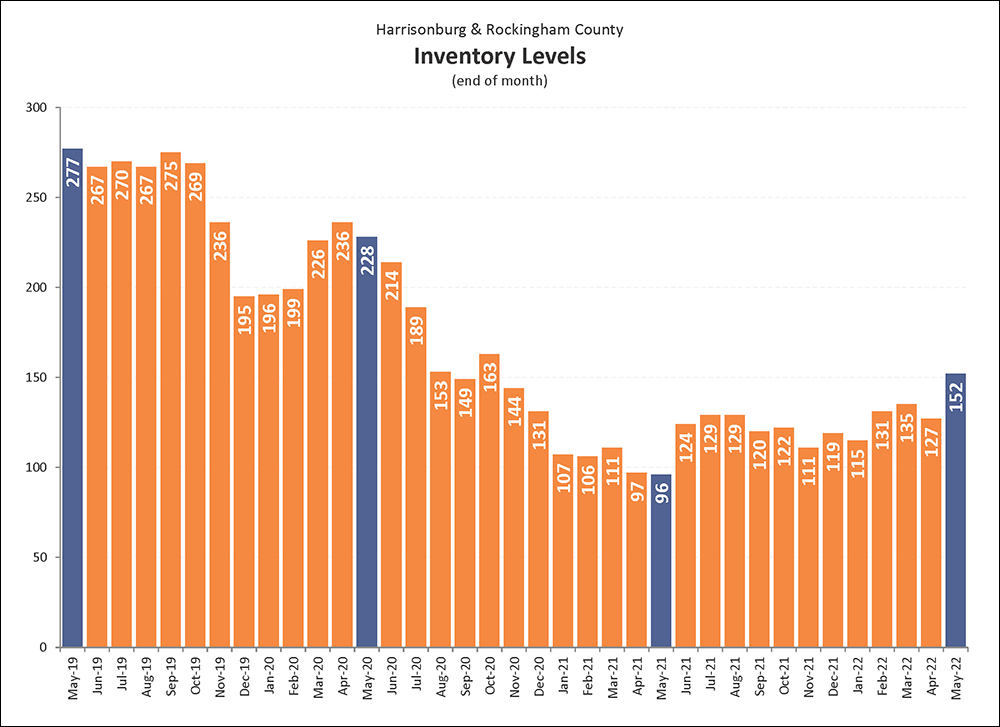
Over the past several years, inventory levels have kept dipped lower. This has not, though, been accompanied by a decline in the pace of home sales. So -- if just as many (or more) buyers are buying, how are they doing it if inventory levels are so low? They’re doing it with speed. The pace of home sales can increase, with inventory levels declining if the median “days on market” is also declining. So, lots of homes are being listed for sale, but they are then going under contract quickly, which keeps inventory levels low but the pace of home sales high. That said, inventory levels have been rising over the past six months.
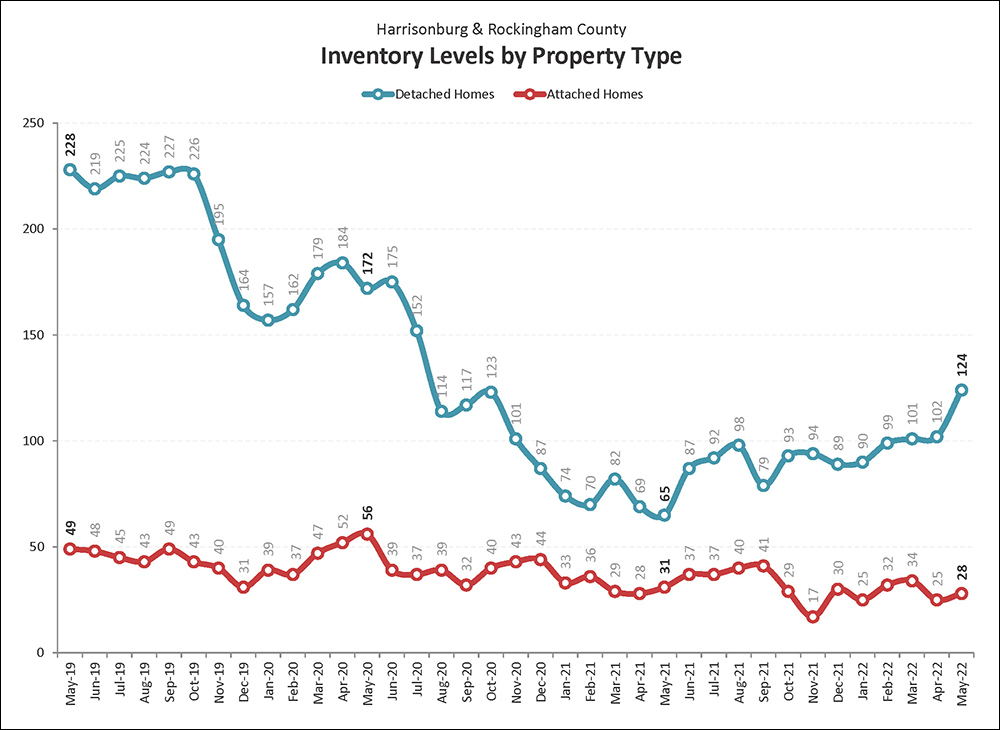
This graph examines the differences in inventory levels over time when examining only single family homes as compared to attached dwellings (townhouses, duplexes, condos). The number of detached homes for sale has declined over the past two years but has increased over the past year... in part due to new construction offerings. The number of attached homes (townhouses, duplexes and condos) for sale has also significantly declined over the past two years though has stayed steadily low over the past year. Normal seasonal changes in inventory levels (more homes on the market in the spring) do not seem to be holding true at this point.
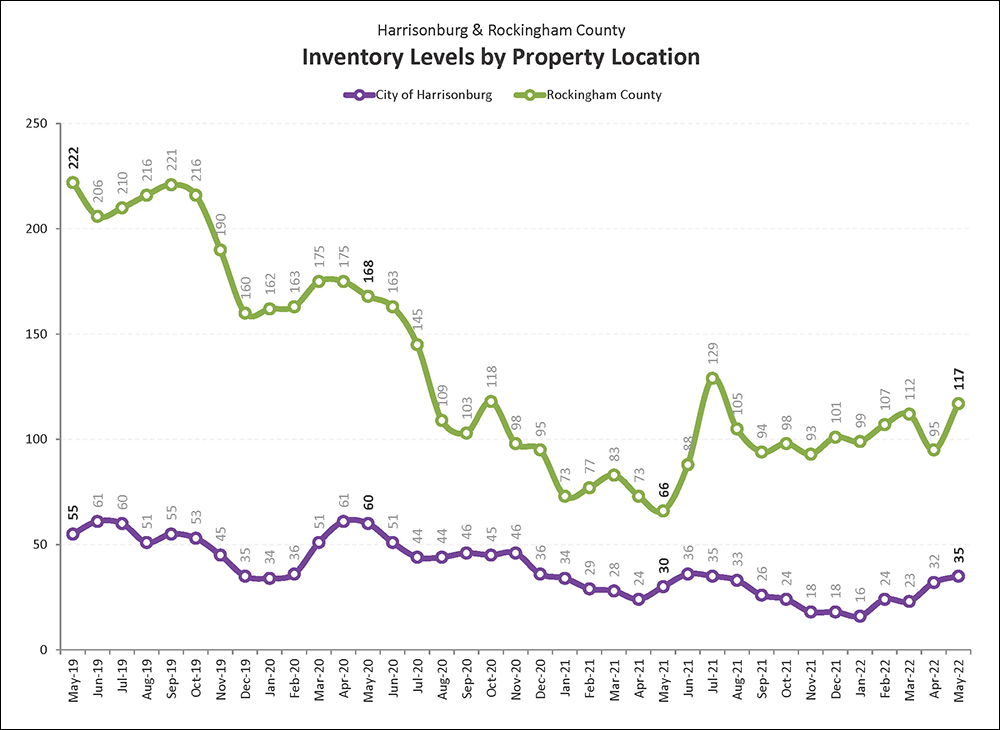
Inventory levels are a good bit higher right now in Rockingham County (117 homes for sale) as compared to a year ago -- though quite a bit below where inventory levels were two years ago. Inventory levels in the City are also slightly higher now (35) than they were a year ago, though that is not much consolation to home buyers hoping to purchase in the City as these homes continue to go under contract quite quickly. It seems unlikely that we will see inventory levels start to meaningfully rise anytime in the near future as buyer demand still seems to be outpacing the supply of homes for sale.
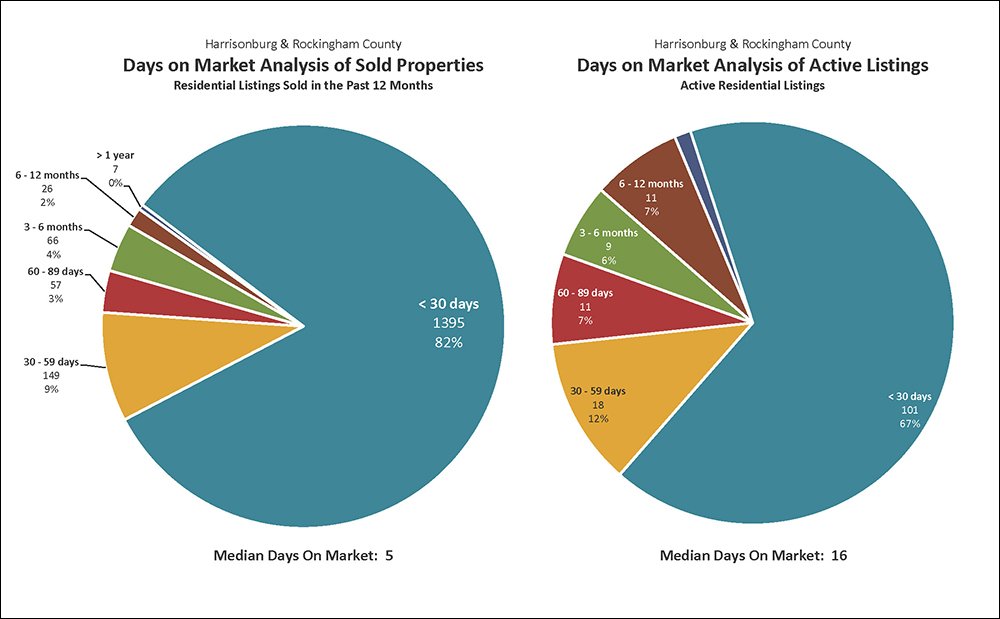
Declining inventory levels are contributing to an overall decline in the time it takes to sell a home in Harrisonburg and Rockingham County. The current median “Days on Market” is 5 days for homes that have sold in the past year. Remarkably, 82% of homes that have sold in the past year have gone under contract within 30 days of having hit the market. Combine that with those that went under contract during the second month on the market, and you’ll find that 91% of homes that sell go under contract within 60 days. The graph to the right, above, shows the length of time that each active listing has been on the market for sale.
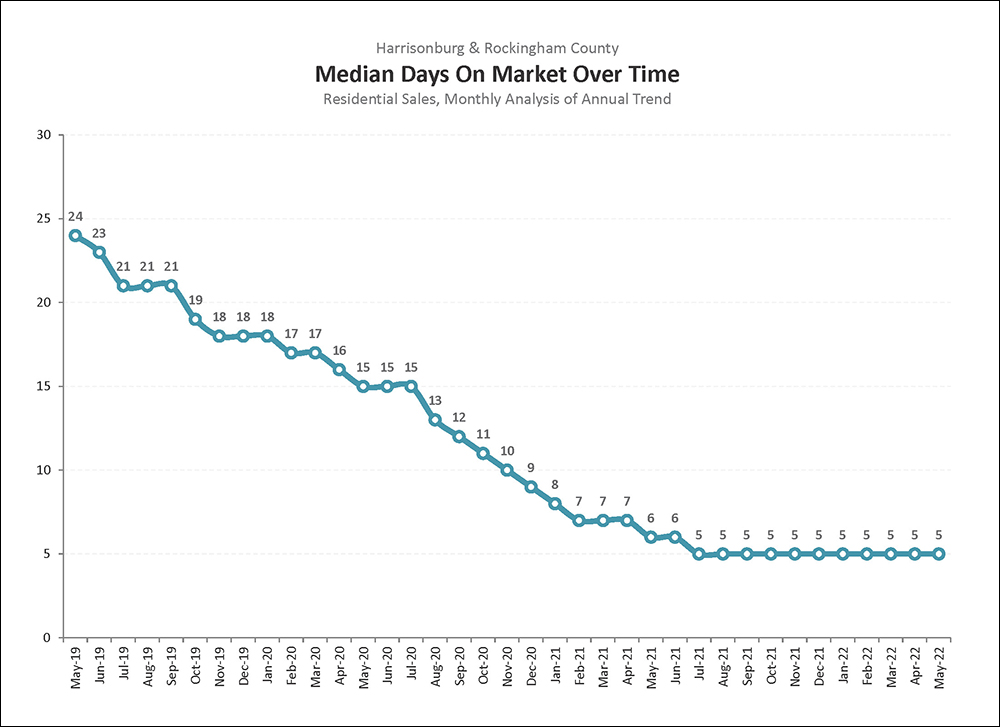
Days on market -- how quickly homes are going under contract -- can be an excellent indication of the mood of the local housing market. Independent of how many homes are selling and the prices at which they are selling -- if they are going under contract quickly then the market is strong and power is tipped towards sellers -- and if homes are taking a longer time to go under contract the market is not quite as strong and power is starting to balance out between sellers and buyers. Over the past three years we have seen a steady decline in how long it takes homes to go under contract, with a current median of five days on the market.
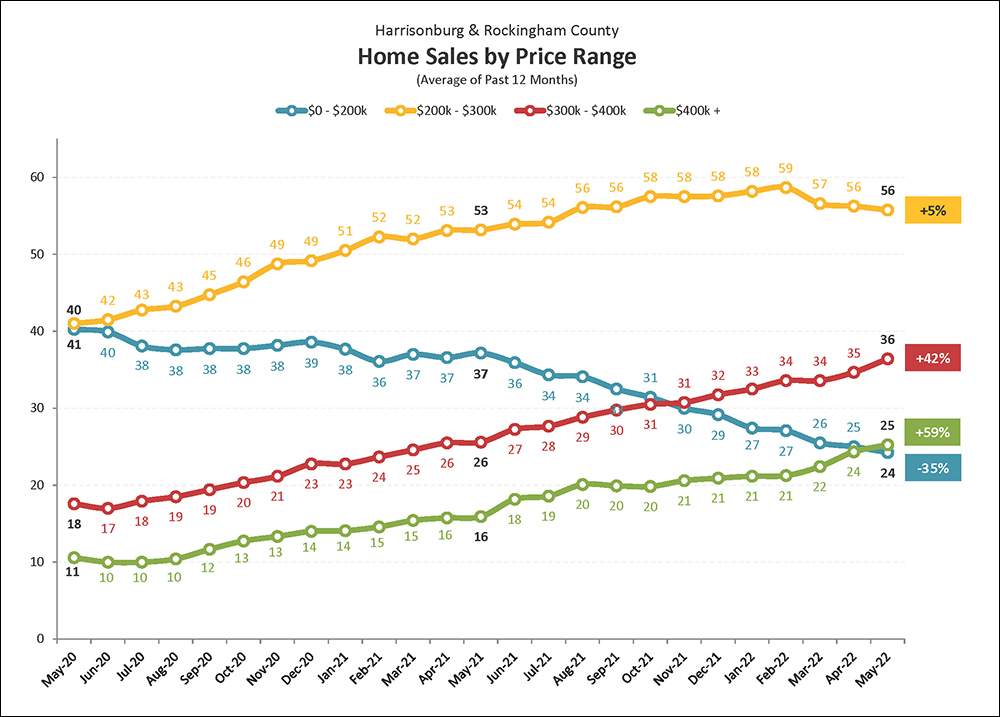
The pace of home sales in Harrisonburg and Rockingham County varies significantly based on price range. The graph above shows the average number of home sales per month (given a 12-month average) as we have passed through the past two years. Home sales have been declining over the past several years in the “under $200K” category -- though likely because of limited inventory, and fewer properties existing in this range based on increasing home values. We have seen year-over-year increases in all three of the other price ranges ($200K-$300K, $300K-$400K, $400K+) over the past year.
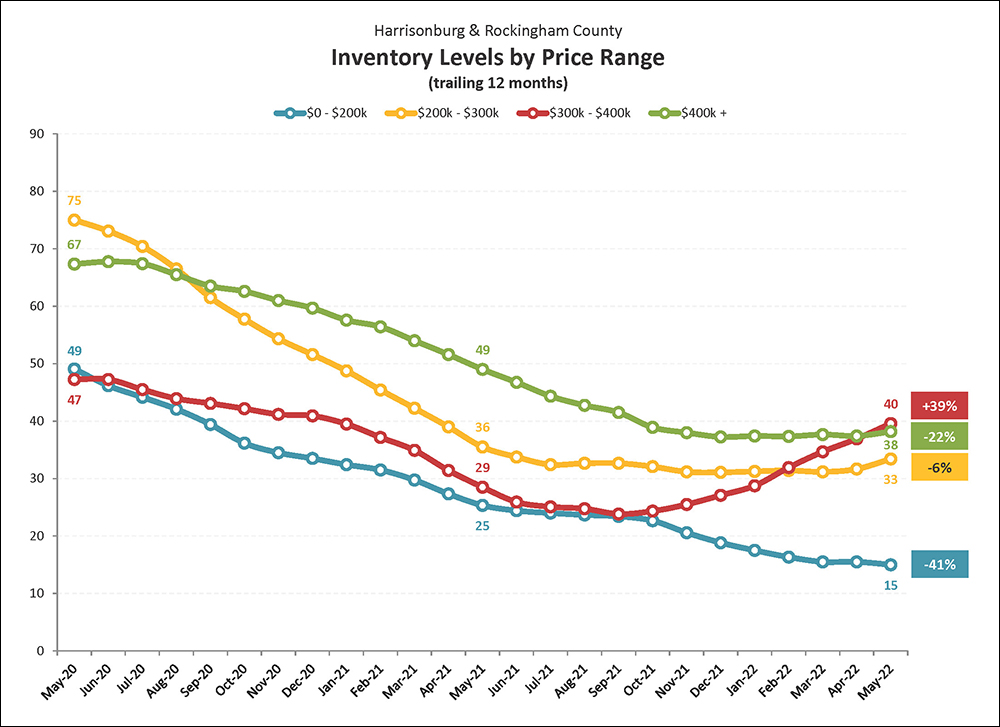
Inventory levels shift up and down seasonally, so this graph looks at changes in average inventory over a 12 month period. We are seeing declines in inventory levels in most price ranges... actually, in all but the $300K - $400K price range. Some, but not all, of these changes in inventory levels are due to changes in market value (increases) over the past few years. Much of the increased inventory in the $300K to $400K price range seems to be new construction offerings in a few new home communities.
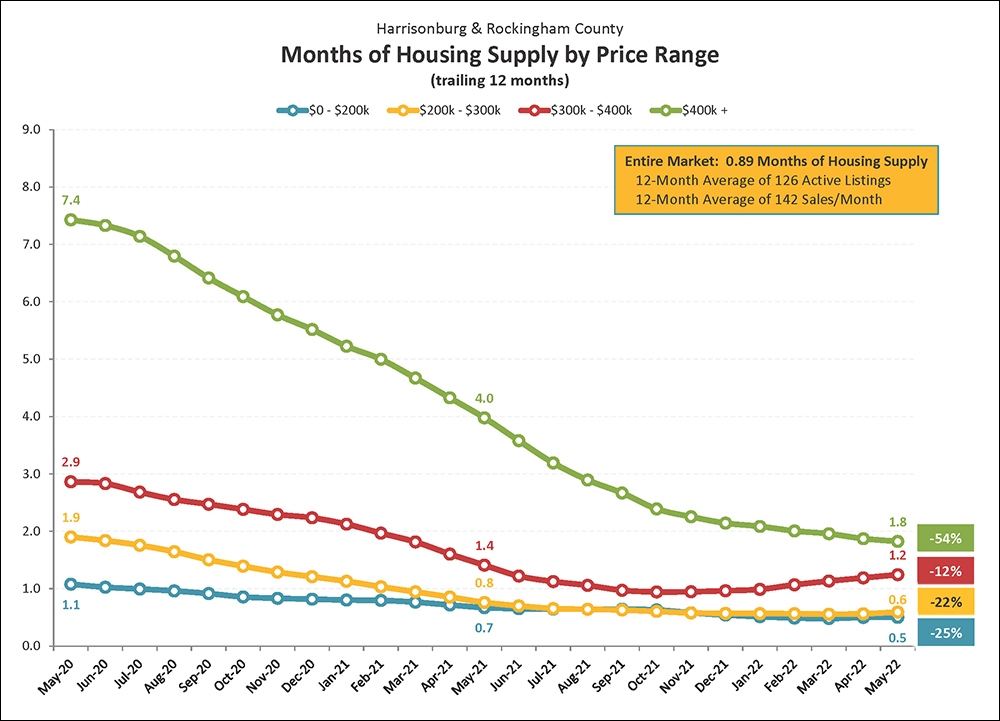
With so many home sales (lots of buyers) and so few homes on the market (not so many sellers), there are low levels of supply in most price ranges in our local real estate market. The graph above illustrates that while it would take about two months to sell all of the homes currently for sale over $400K if the same number of buyers bought each month as have been buying (on average) over the past 12 months and if no new listings came on the market -- but it would take a month or less (!!!) to go through the inventory under $300K and just over a month to go through the inventory between $300K and $400K.
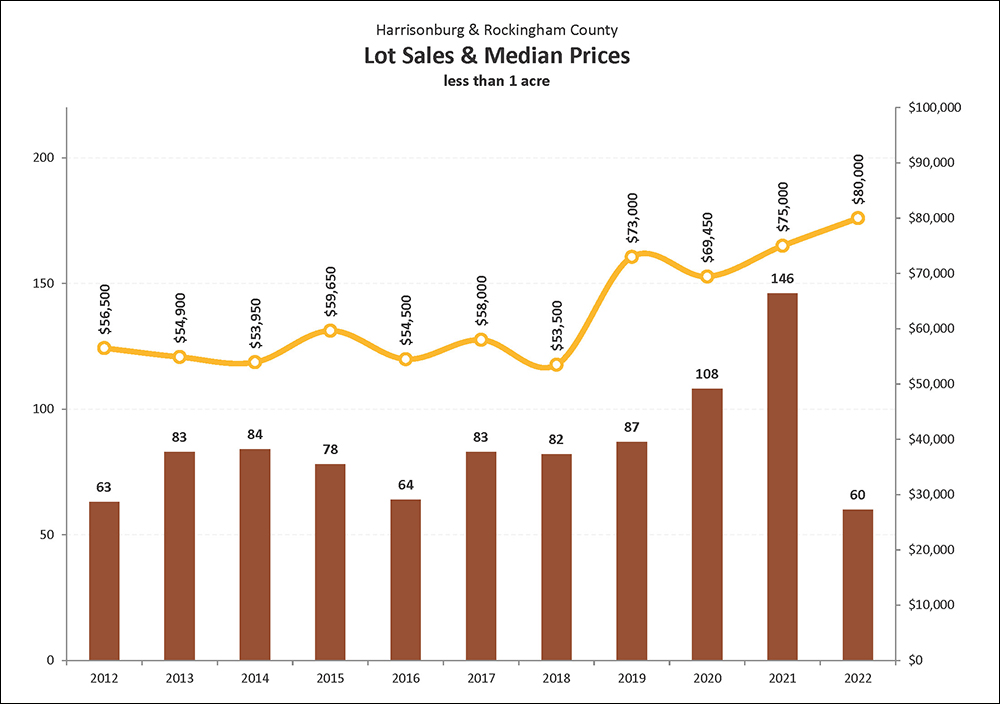
For six of the seven years between 2013 and 2019 we saw right around 80 sales per year of lots of less than an acre in Harrisonburg and Rockingham County. In 2020, that annual pace of sales increased a good bit to 108 sales of building lots. Despite that increase in the number of lot sales, the median sales price for those lots declined slightly to $69,450. That decline is likely a result of which particular lots sold, not necessarily an indication that all lots are selling at lower prices now than they were a year ago. We then saw 146 lot sales in 2021, which means last year was the strongest year of lot sales in the past decade.
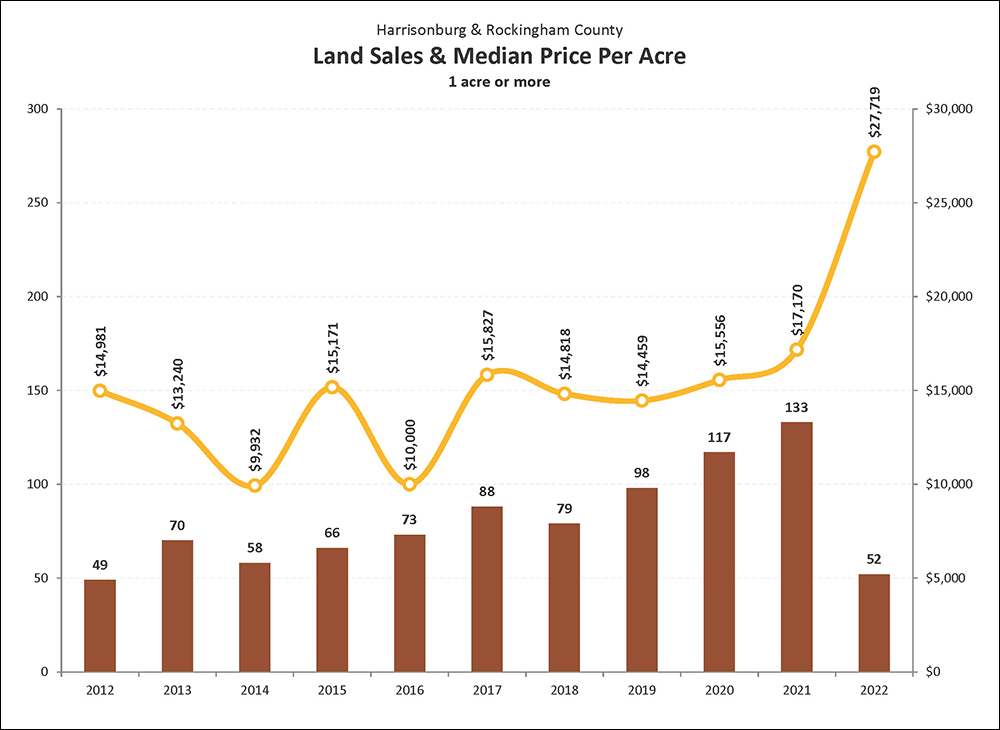
The pace of sales of parcels of land larger than one acre in Harrisonburg or Rockingham County has increased over the past ten years to 133 land sales in 2021-- marking the highest year of sales in over 15 years. The median price per acre had remained right around $15,000 per acre for four years between 2017 and 2020 but increased to just over $17,000 in 2021. Of note -- some aspects of this “median price per acre” calculation are affected by which parcels actually sell in a given year. The increase in buyer demand over the past 10 years has not seemed to have created any significant upward lifting pressure on values to date.
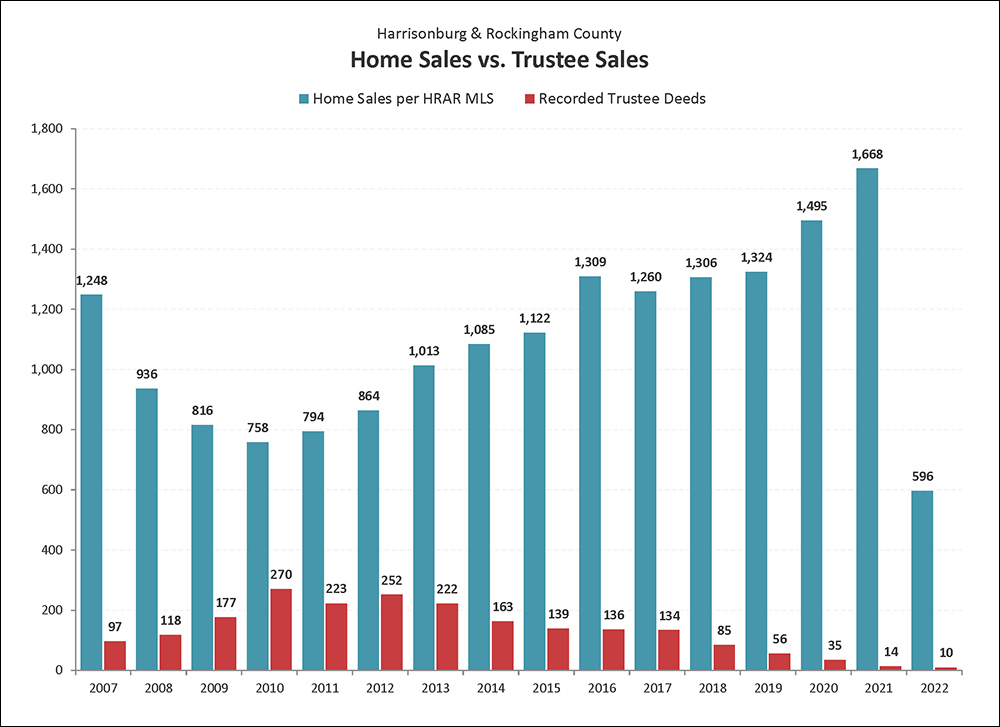
The graph above is a comparison of two imprecise measures -- but the comparison can still be helpful. The blue bars show the number of home sales recorded in the HRAR MLS -- this does not include private sales that did not involve a Realtor, nor new home sales directly from a builder. The red bars show the number of recorded Trustee Deeds. Some foreclosed properties then show up again as REO properties. The foreclosure rate in our local market area has been trending downward over the past nine years and is now at the lowest level seen anytime in the past 15 years! The moratorium on foreclosures likely kept that figure low in 2020 and 2021.
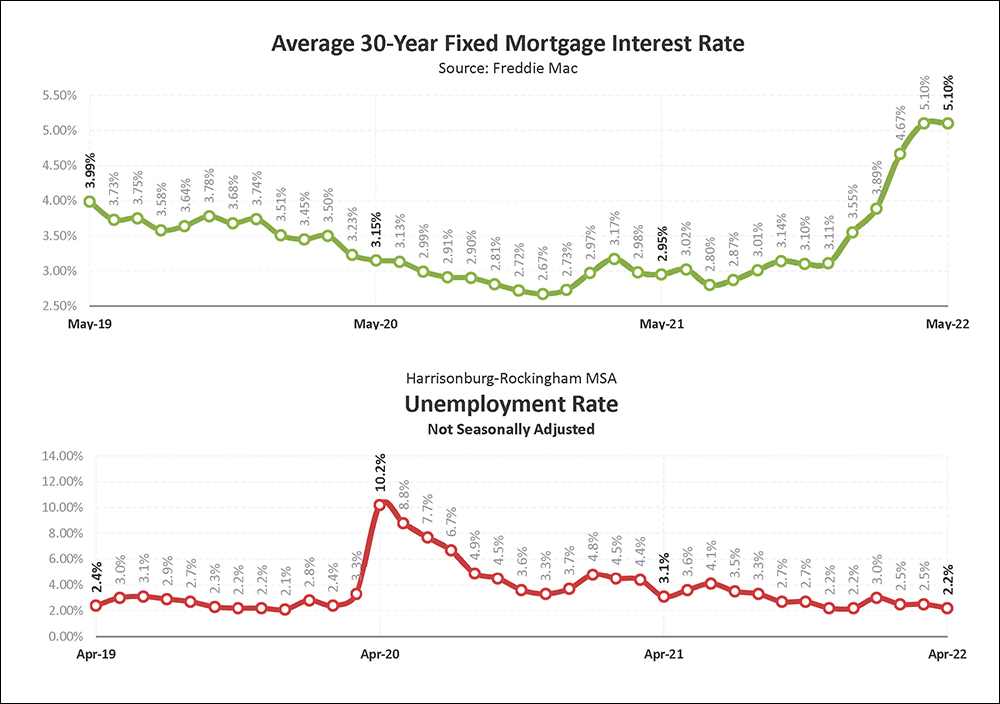
As shown in the top graph, over the past several years mortgage interest rates steadily declined to a historic low rate of 2.67% in December 2020 before climbing throughout 2021, but not much above 3%. In 2022, however, mortgage rates have been climbing much more quickly, crossing the 5% threshhold at the end of April and staying there in May. The second graph illustrates trends in the local unemployment rate, which has now returned to the typical 2% - 3% range after having peaked at 10.2% during the start of the COVID-19 pandemic. Low local unemployment rates and low mortgage interest rates help our local housing market remain stable.